
Clickstream analytics case study. Part II: ClickHouse <-> Airflow
Written By: Igor Mosyagin, Developer Advocate at DoubleCloud
Introduction
Welcome back to our series on building a real-time analytics system. We’re exploring how to set up a powerful analytics platform using DoubleCloud’s managed services. This series covers everything from getting data in, to crunching numbers, to creating eye-catching dashboards.
In this second post, we’ll show you how to set up an Airflow cluster. We’ll use it to run a batch job that takes the data we loaded in the first step and turns it into useful summaries. This is a key part of making our analytics system efficient and reliable.
If you missed our first post about initial setup and data loading, you can find it here.
Data Solution overview
Le’s recap our overall data platform architecture.
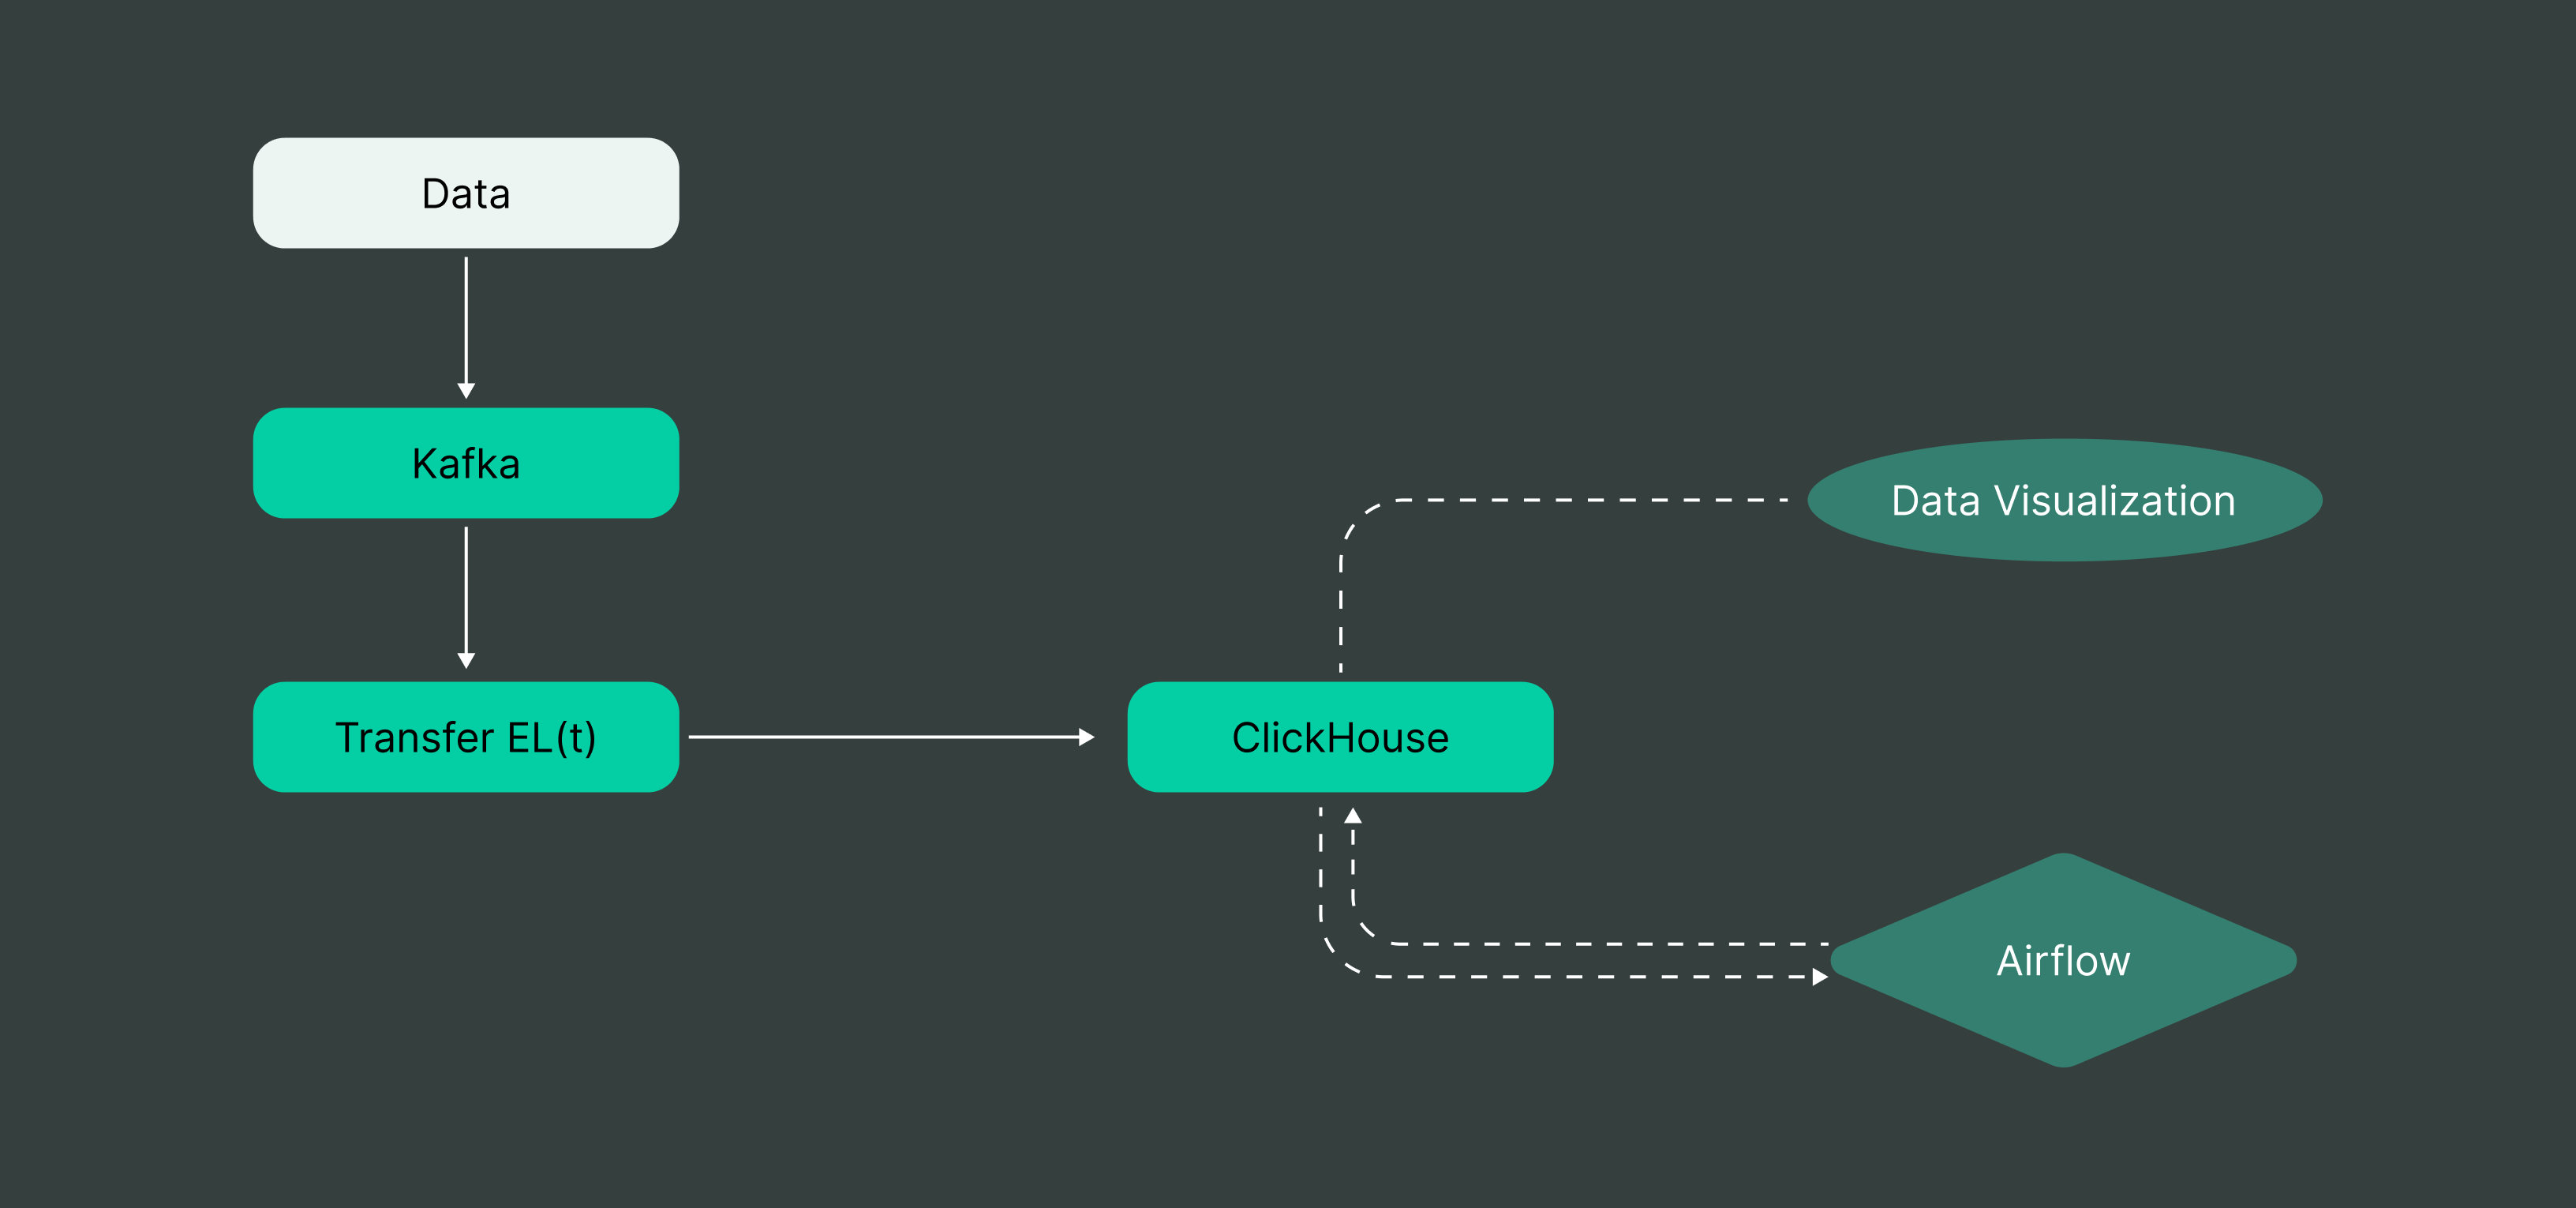
In our previous post, we focused on building the ingestion side. Now, we’re moving on to the next crucial step: aggregations.
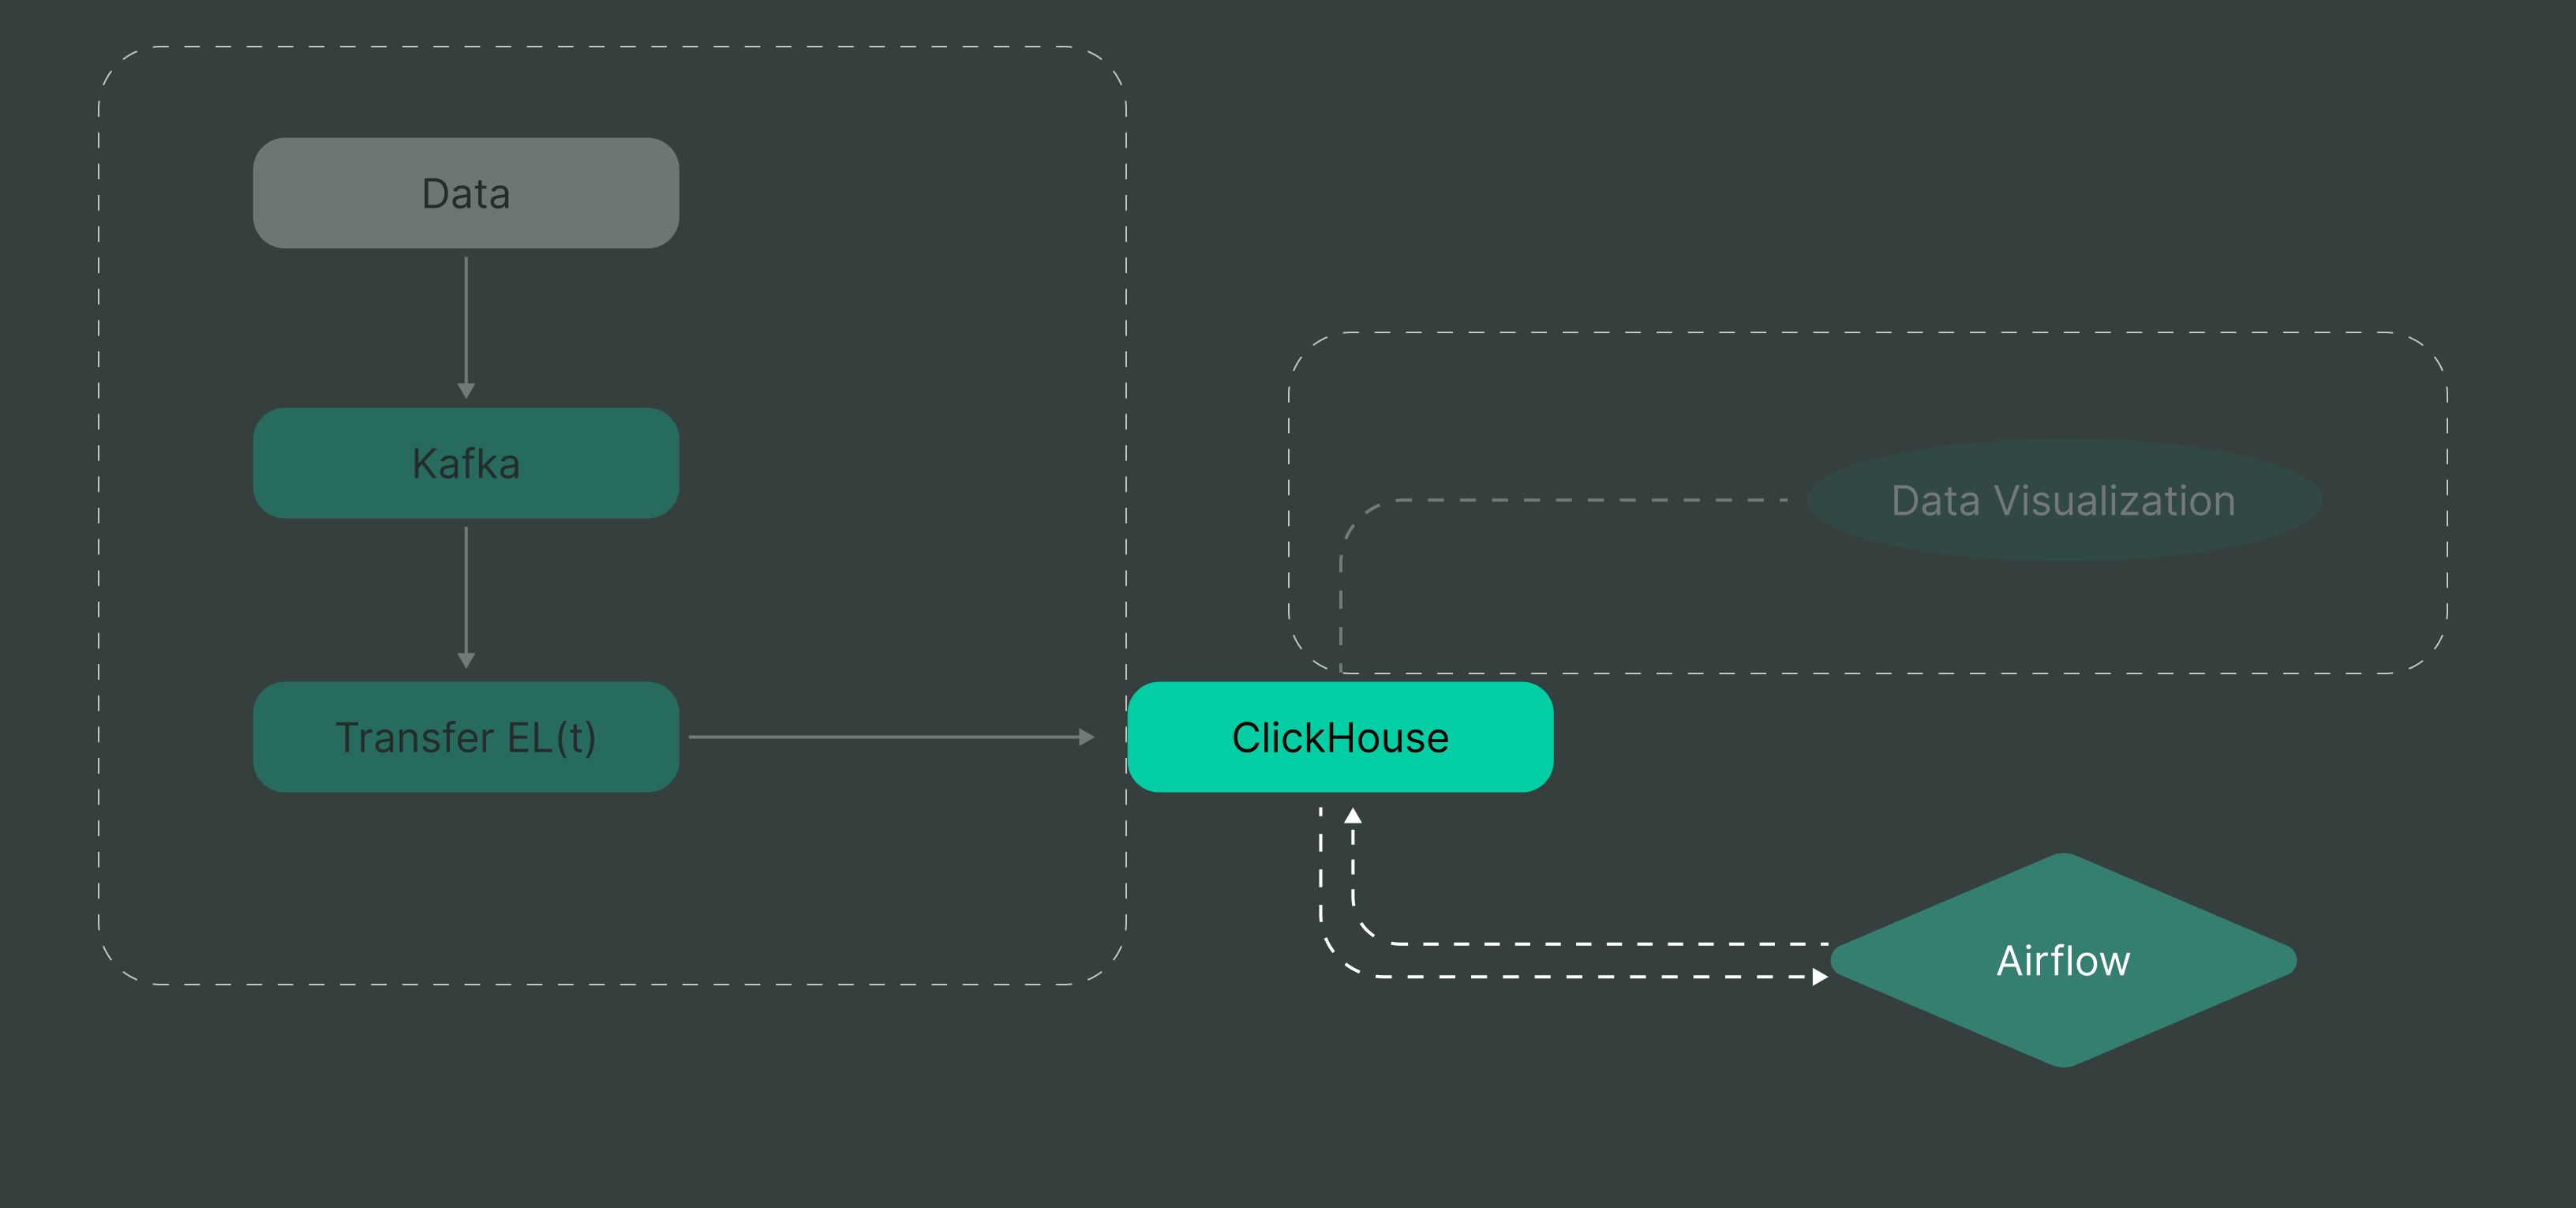
We’ve successfully set up our data pipeline, so our next challenge is to compute and automate aggregation. This is where we turnraw data into actionable insights.
A quick note on batch processing
You might be wondering: “Wait, isn’t this series about real-time analytics? Why are we talking about batch processing?”
Great question! While our end goal is real-time analytics, it’s important to remember that a robust data platform often combines both real-time and batch processing. Batch processing is crucial for handling large volumes of historical data, performing complex analyses, and creating aggregated views that complement our real-time insights.
In many real-world scenarios, you’ll need both approaches to get a complete picture of your data. The common knowledge is that real time processing gives you immediate insights, while batch processing allows for more in-depth, comprehensive analysis. By covering batch processing in this post, we’re making sure that we’re building a well-rounded platform that can handle various analytical needs.
Setup Airflow cluster
Let’s start by creating our Airflow cluster. This process takes a bit of time, so it’s a good idea to get it started first and then move on to other tasks while it sets up. The new Airflow cluster can be created from a cluster tab in the DoubleCloud console. I’ll use a small production environment configuration for this example.
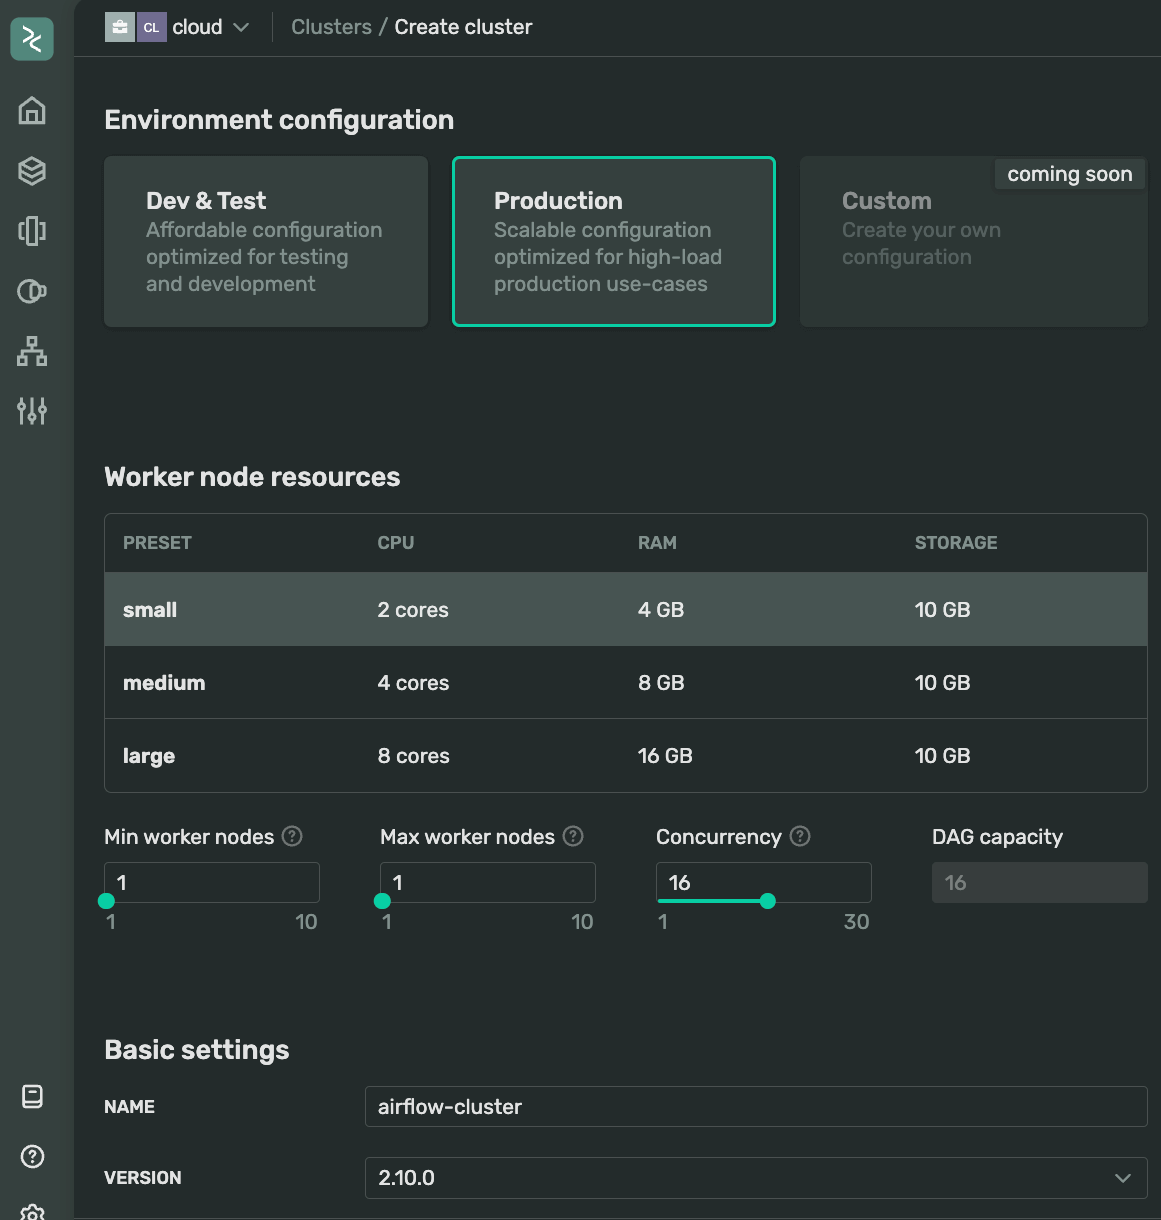
I’m using the latest available version 2.10.0 which comes with a sleek dark theme and some handy features. We usually try to make sure new Airflow versions are available in a few days after they get released by the Airflow community. Remember, our platform allows you to create custom images if you need more specific setups. The default DoubleCloud Airflow comes with the ClickHouse plugin pre-installed, so you’re all set to work with your ClickHouse cluster.
For this demo, I continue using the same repository. If you’re planning to use yours, make sure:
- You can access it with the provided credentials or it’s publicly accessible
- You’re using the correct branch
- You’ve specified the right path to the DAG folder
Here’s my setup: I’m using the trunk branch, and my DAGs are in the dags folder at the root of my repo.
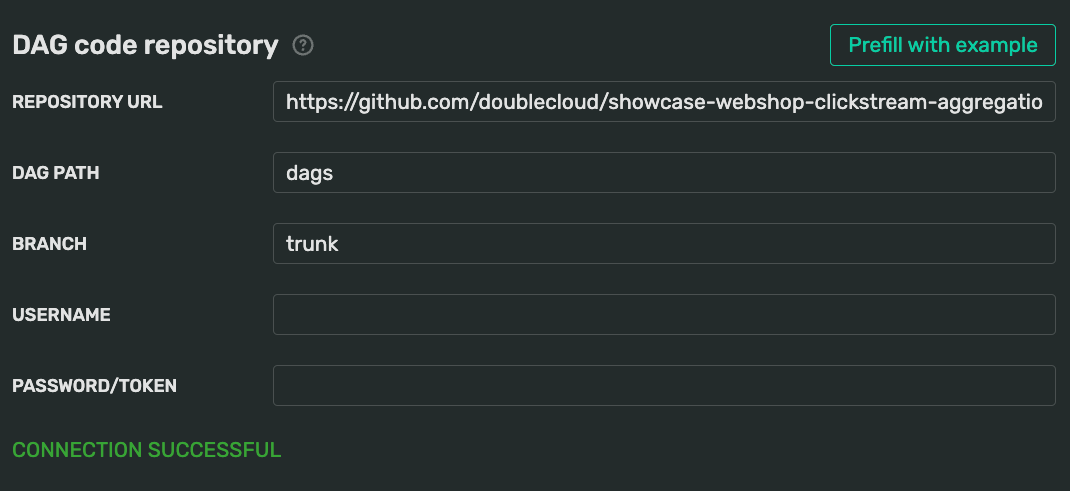
If repository is private, you’ll need to provide a username and a password or Personal Access Token (PAT). Check your version control system’s documentation for details on setting this up.
The DAG folder will be mounted using git-sync. This means you can update your DAGs by simply pushing changes to your git branch — no need to update the cluster itself.
For now, I’ll keep all other settings at their defaults and hit “Submit” to start provisioning. While my cluster is spinning up, let’s make good use of this time and do some exploratory data analysis. This will help understand our data better nad help structure our Airflow-enhanced queries.
Aggregations
Our data consists of events from various parties, and our goal is to group them effectively. Let’s start with some EDA on our sample of 1,000 events using WebSQL. This will help understand what aggregations we can compute.
Exploring sample clickstream data
First, let’s remind ourselves about the table columns and their types. In ClickHouse, we can do this using the DESCRIBE <tablename> command.
Here’s how it looks in WebSQL query editor:
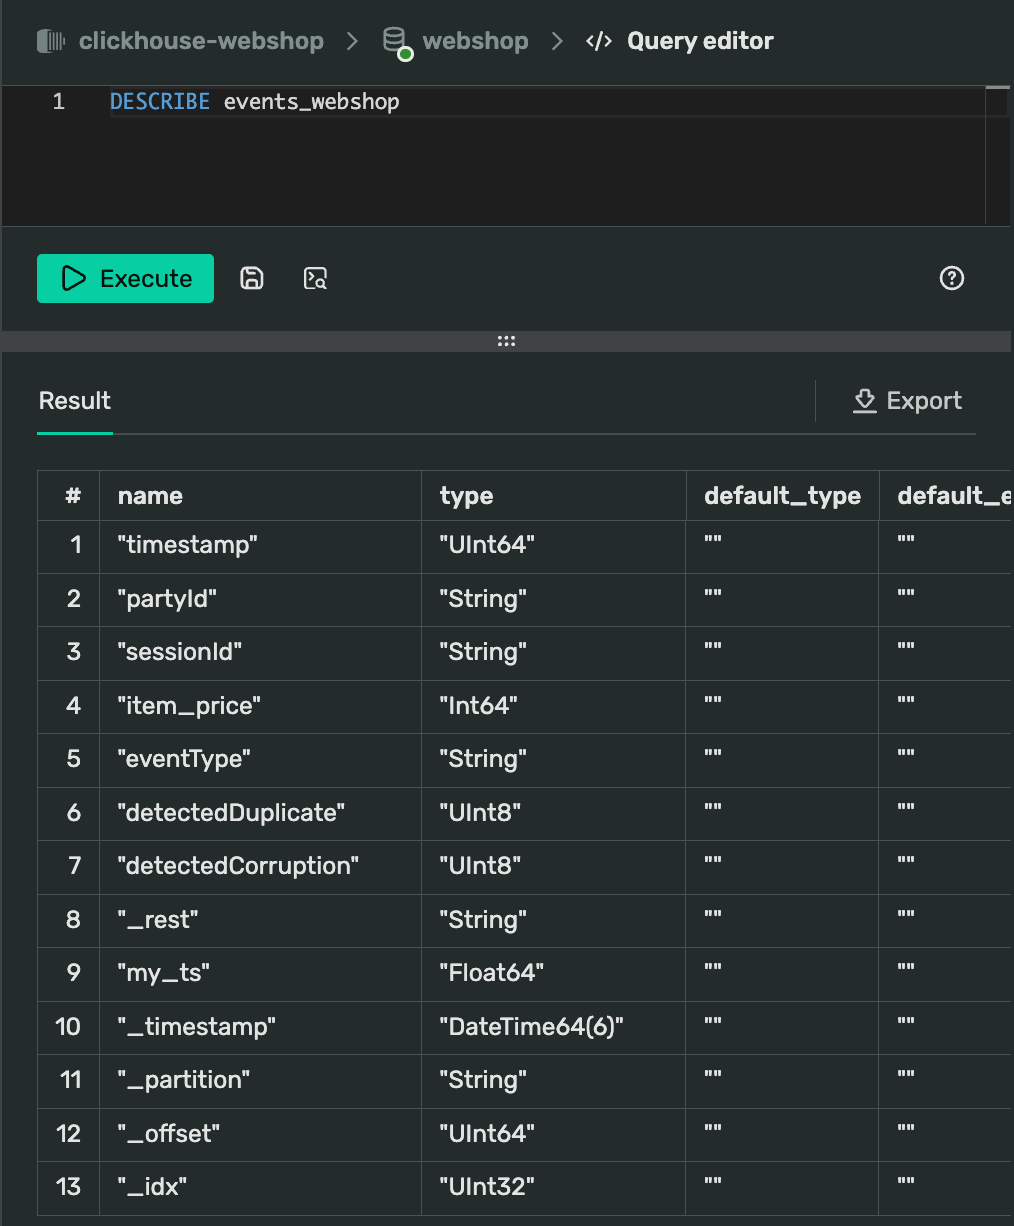
Our landing table is quite extensive, but the xey fields for our analysis are:
partyIdsessionIdItem_priceeventTypedetectedDuplicatedetectedCorruptionmy_ts(containing the adjusted timestamp)
Now’ let’s check for duplicates and corruption in our data:
SELECT eventType, detectedDuplicate, detectedCorruption, COUNT(*) FROM events_webshop GROUP BY 1,2,3 ORDER BY 1,2,3
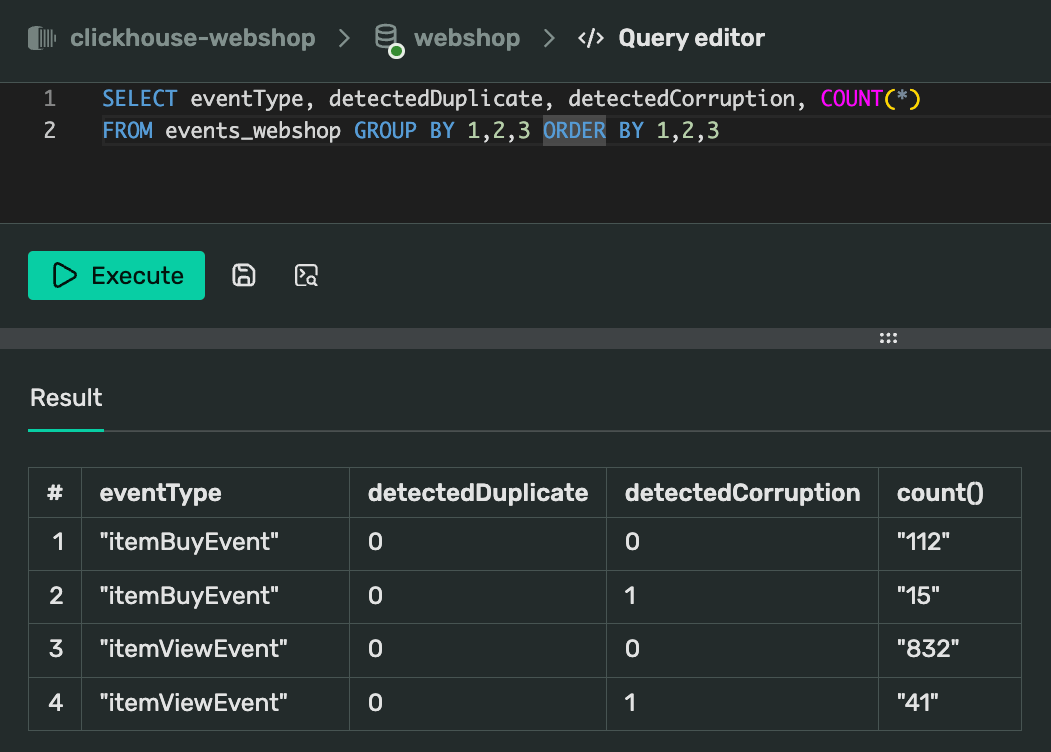
Interestingly, our sample doesn’t show any detected duplicates, but there are some events marked as corrupted. Given our small sample size of 1,000 events, we won’t focus too much on duplicates now, but it’s something to keep in mind for larger samples.
Let’s move on to some more useful aggregations. We’ll compute how many visitors we had each hour in our dataset. ClickHouse offers many functions for working with datetime data, all expecting DateTime64 format.
I’ll cast the values on the fly:
SELECT
        toStartOfHour(my_ts::DateTime64) AS hour,
        COUNT(DISTINCT partyId) AS visitors,
        COUNT(*) AS total_events,
        MIN(my_ts::DateTime64) AS mnts,
        MAX(my_ts::DateTime64) AS mxts
FROM events_webshop GROUP BY hour ORDER BY hour
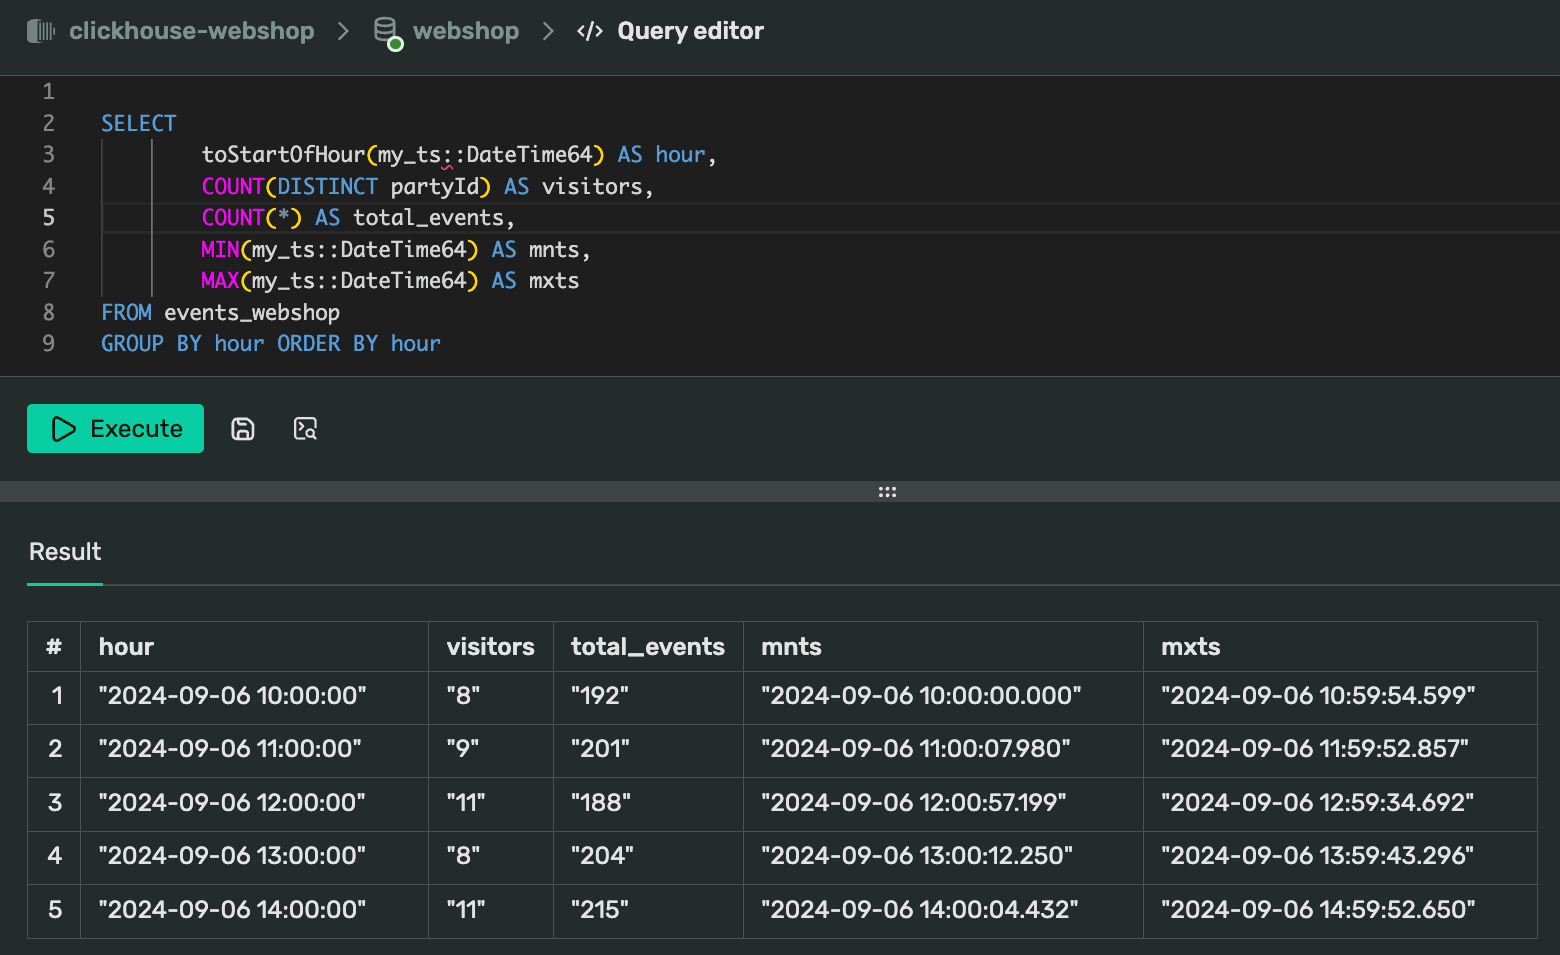
From these results, we can see that our 1,000-event sample spans 5 hours, with a fairly even distribution of events across each hour. The events are clustered at the start and end of each hour. We also notice that our visitor count is quite low, but it’s sufficient for building our initial pipeline.
Performance metrics for sample data
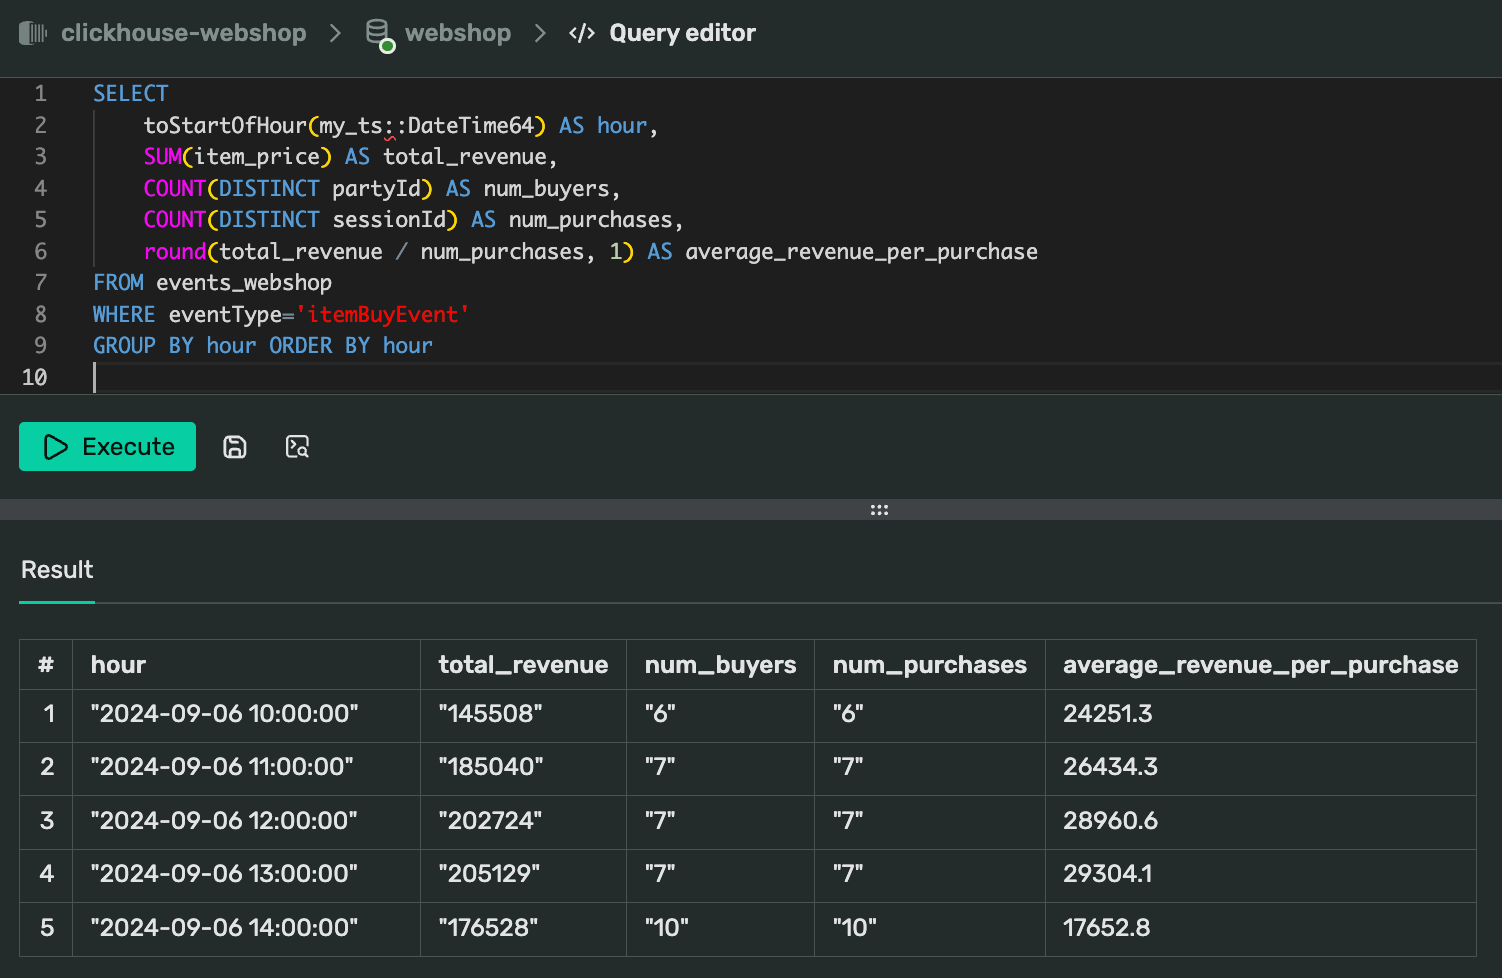
Our dataset includes two event types: itemBuyEvent and itemViewEvent. We’ve already counted visitors, but now let’s focus on purchases and revenue metrics, grouped by hour:
-
Total revenue: sum of all
item_pricefields for events witheventType = itemBuyEvent -
Number of buyers: count of distinct
partyId -
Total purchases: count of distinct
sessionIdper hour -
Average revenue per purchase: total revenue divided by number of purchases
Here’s the SQL query to calculate these metrics:
SELECT
    toStartOfHour(my_ts::DateTime64) AS hour,
    SUM(item_price) AS total_revenue,
    COUNT(DISTINCT partyId) AS num_buyers,
    COUNT(DISTINCT sessionId) AS num_purchases,
    round(total_revenue / num_purchases, 1) AS average_revenue_per_purchase
FROM events_webshop WHERE eventType='itemBuyEvent' GROUP BY hour ORDER BY hour
Putting it all together
Now that we have our performance metrics, let’s combine them with our visitor data and apply our filtering criteria for duplicates and corruption. I will use Common Tabls Experssions (CTEs) to organize the resulting query:
WITH good_data AS (
    SELECT * FROM webshop.events_webshop
    WHERE 1=1
        AND detectedDuplicate=false
        AND detectedCorruption=false
), visitors AS (
    SELECT
        toStartOfHour(my_ts::DateTime64) AS hour,
        COUNT(DISTINCT partyId) AS visitors
    FROM good_data
    GROUP BY hour
), performance AS (
    SELECT
        toStartOfHour(my_ts::DateTime64) AS hour,
        SUM(item_price) AS total_revenue,
        COUNT(DISTINCT partyId) AS num_buyers,
        COUNT(DISTINCT sessionId) AS num_purchases
        round(total_revenue / num_purchases, 1) AS average_revenue_per_purchase
    FROM good_data
    WHERE eventType='itemBuyEvent'
    GROUP BY hour
) SELECT
    v.hour,
    v.visitors,
    p.num_buyers,
    p.num_purchases,
    p.total_revenue,
    p.average_revenue_per_purchase
FROM visitors v JOIN performance p ON v.hour = p.hour ORDER BY hour
You can find the full query at github here.
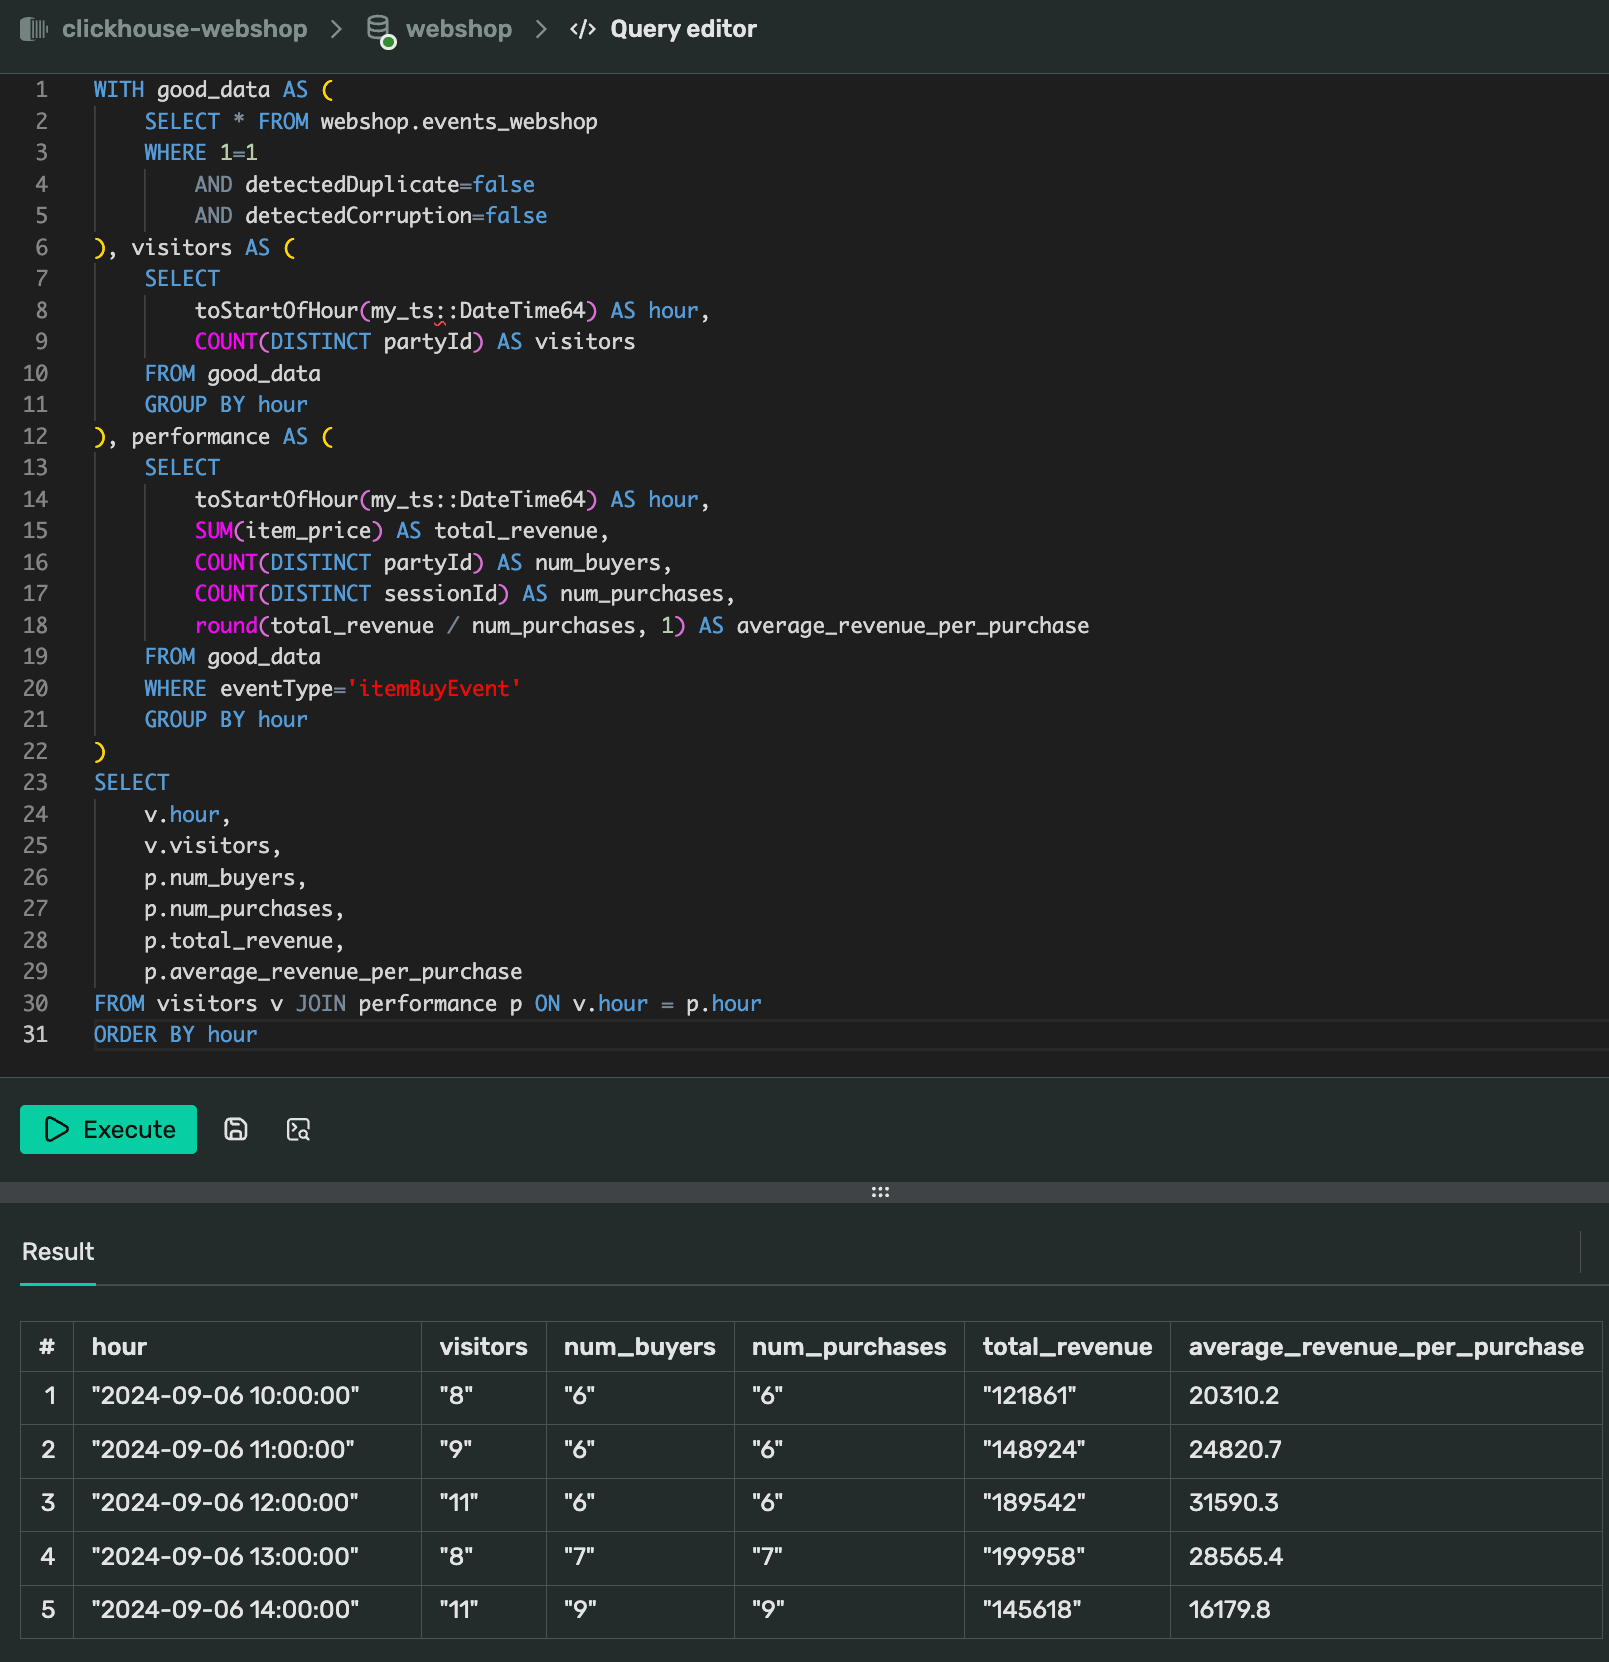
This query combines all the metrics we need for our analysis. It filters out duplicates and corrupted data, calculates visitor and performance metrics, and joins them together for a comprehensive hourly view of our webshop’s performance.
Now that we have our final query, let’s move on to automating this process with Airflow.
Back to Airflow
Once the cluster is up and running, you can access the Web UI from the Cluster panel via the Web Server Connection link.
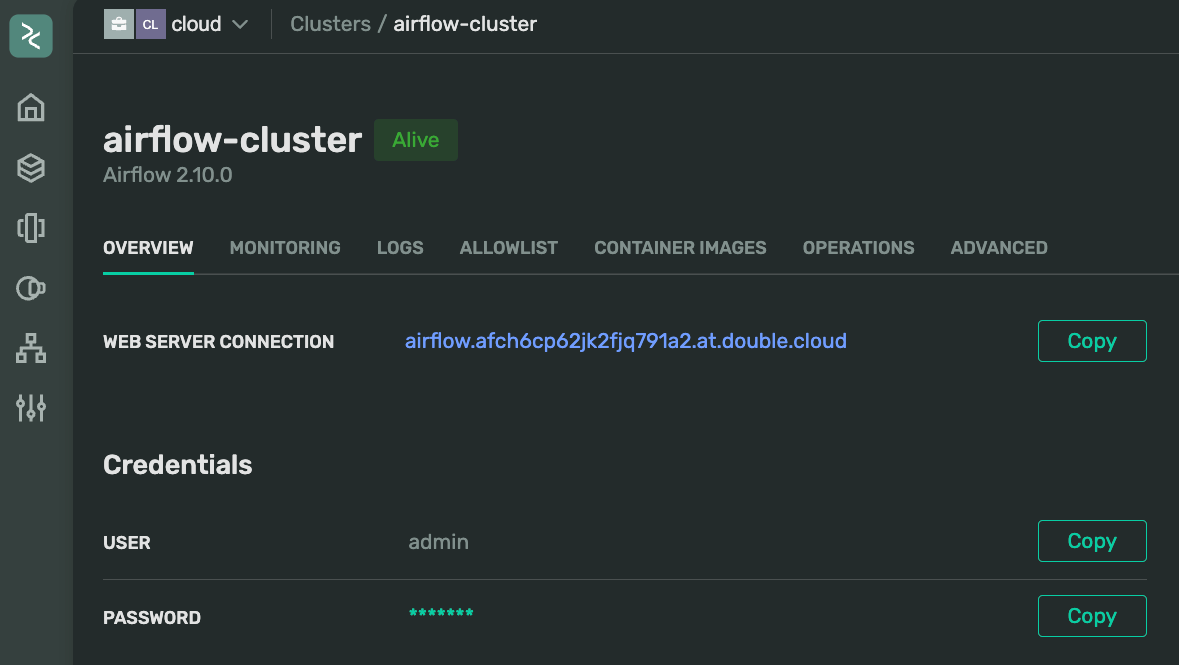
Allowlist reminder: DoubleCloud automatically adds your IP address to the ALLOWLIST in the cluster settings. Keep this in mind if you frequently change networks, like switching Wi-Fi on your laptop. If the Web Server connection link doesn’t open, make sure your IP is in the list.
Initially, your new cluster will have no enabled DAGs, presenting an empty dashboard. This is normal for a fresh setup.

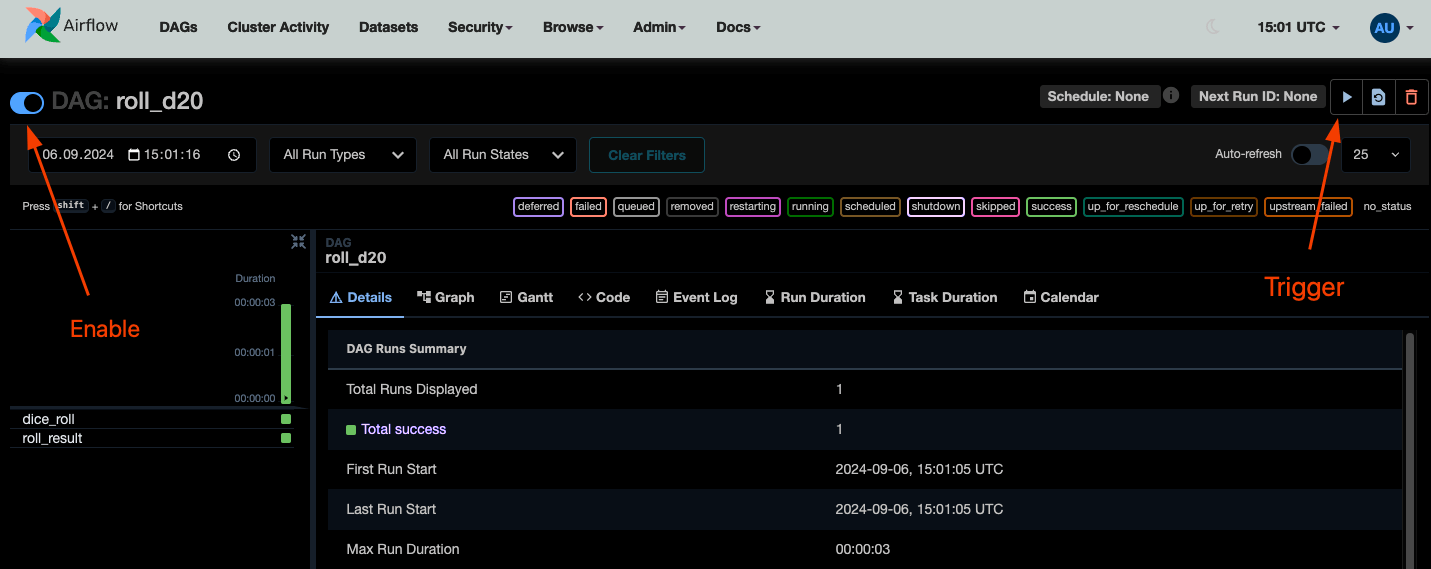
Let’s start by enabling and triggering the roll_d20 DAG (src here). This simple two-task DAG isn’t connecting to any external system, — it’s just to verify that our Airflow setup is complete and workers are functioning. trigger it, and watch it being executed (you can actually just trigger disabled dag and it will be enabled automatically).
You can access the logs for each task through the Logs tab when you select a DAG run and a task:
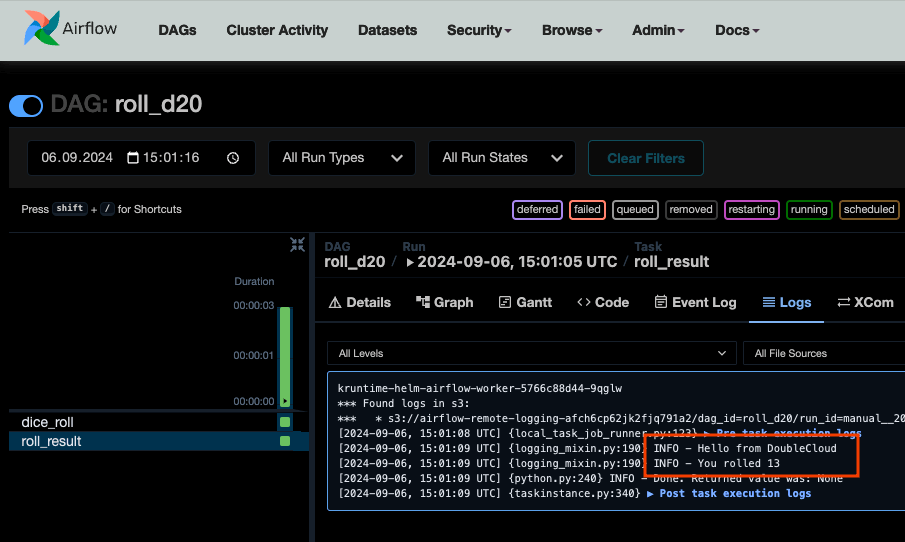
Looks like I got lucky — my DAG run rolled a 13!
Now, if we try running our compute_full_perf_metrics, DAG (src here), it will fail:
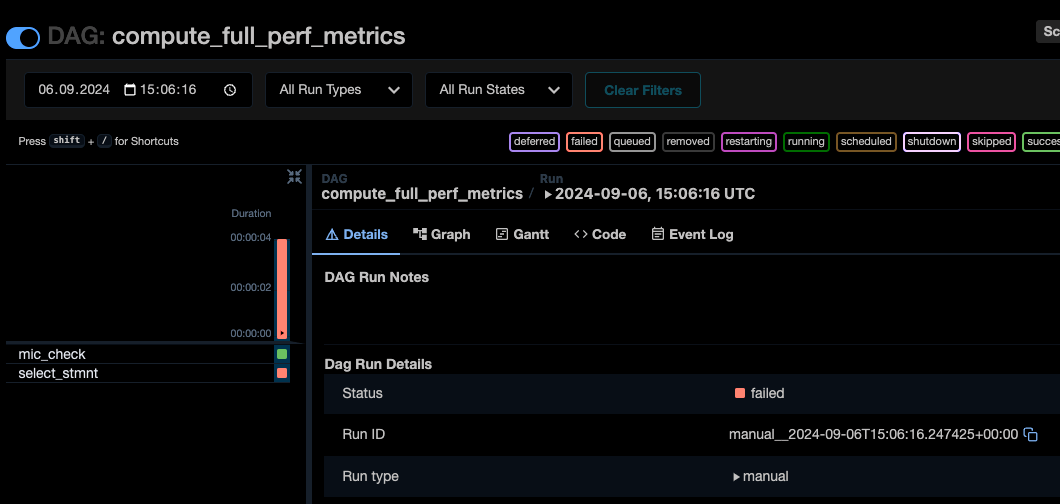
This is expected, because our newly created cluster doesn’t know about our ClickHouse server yet. The logs confirm this:
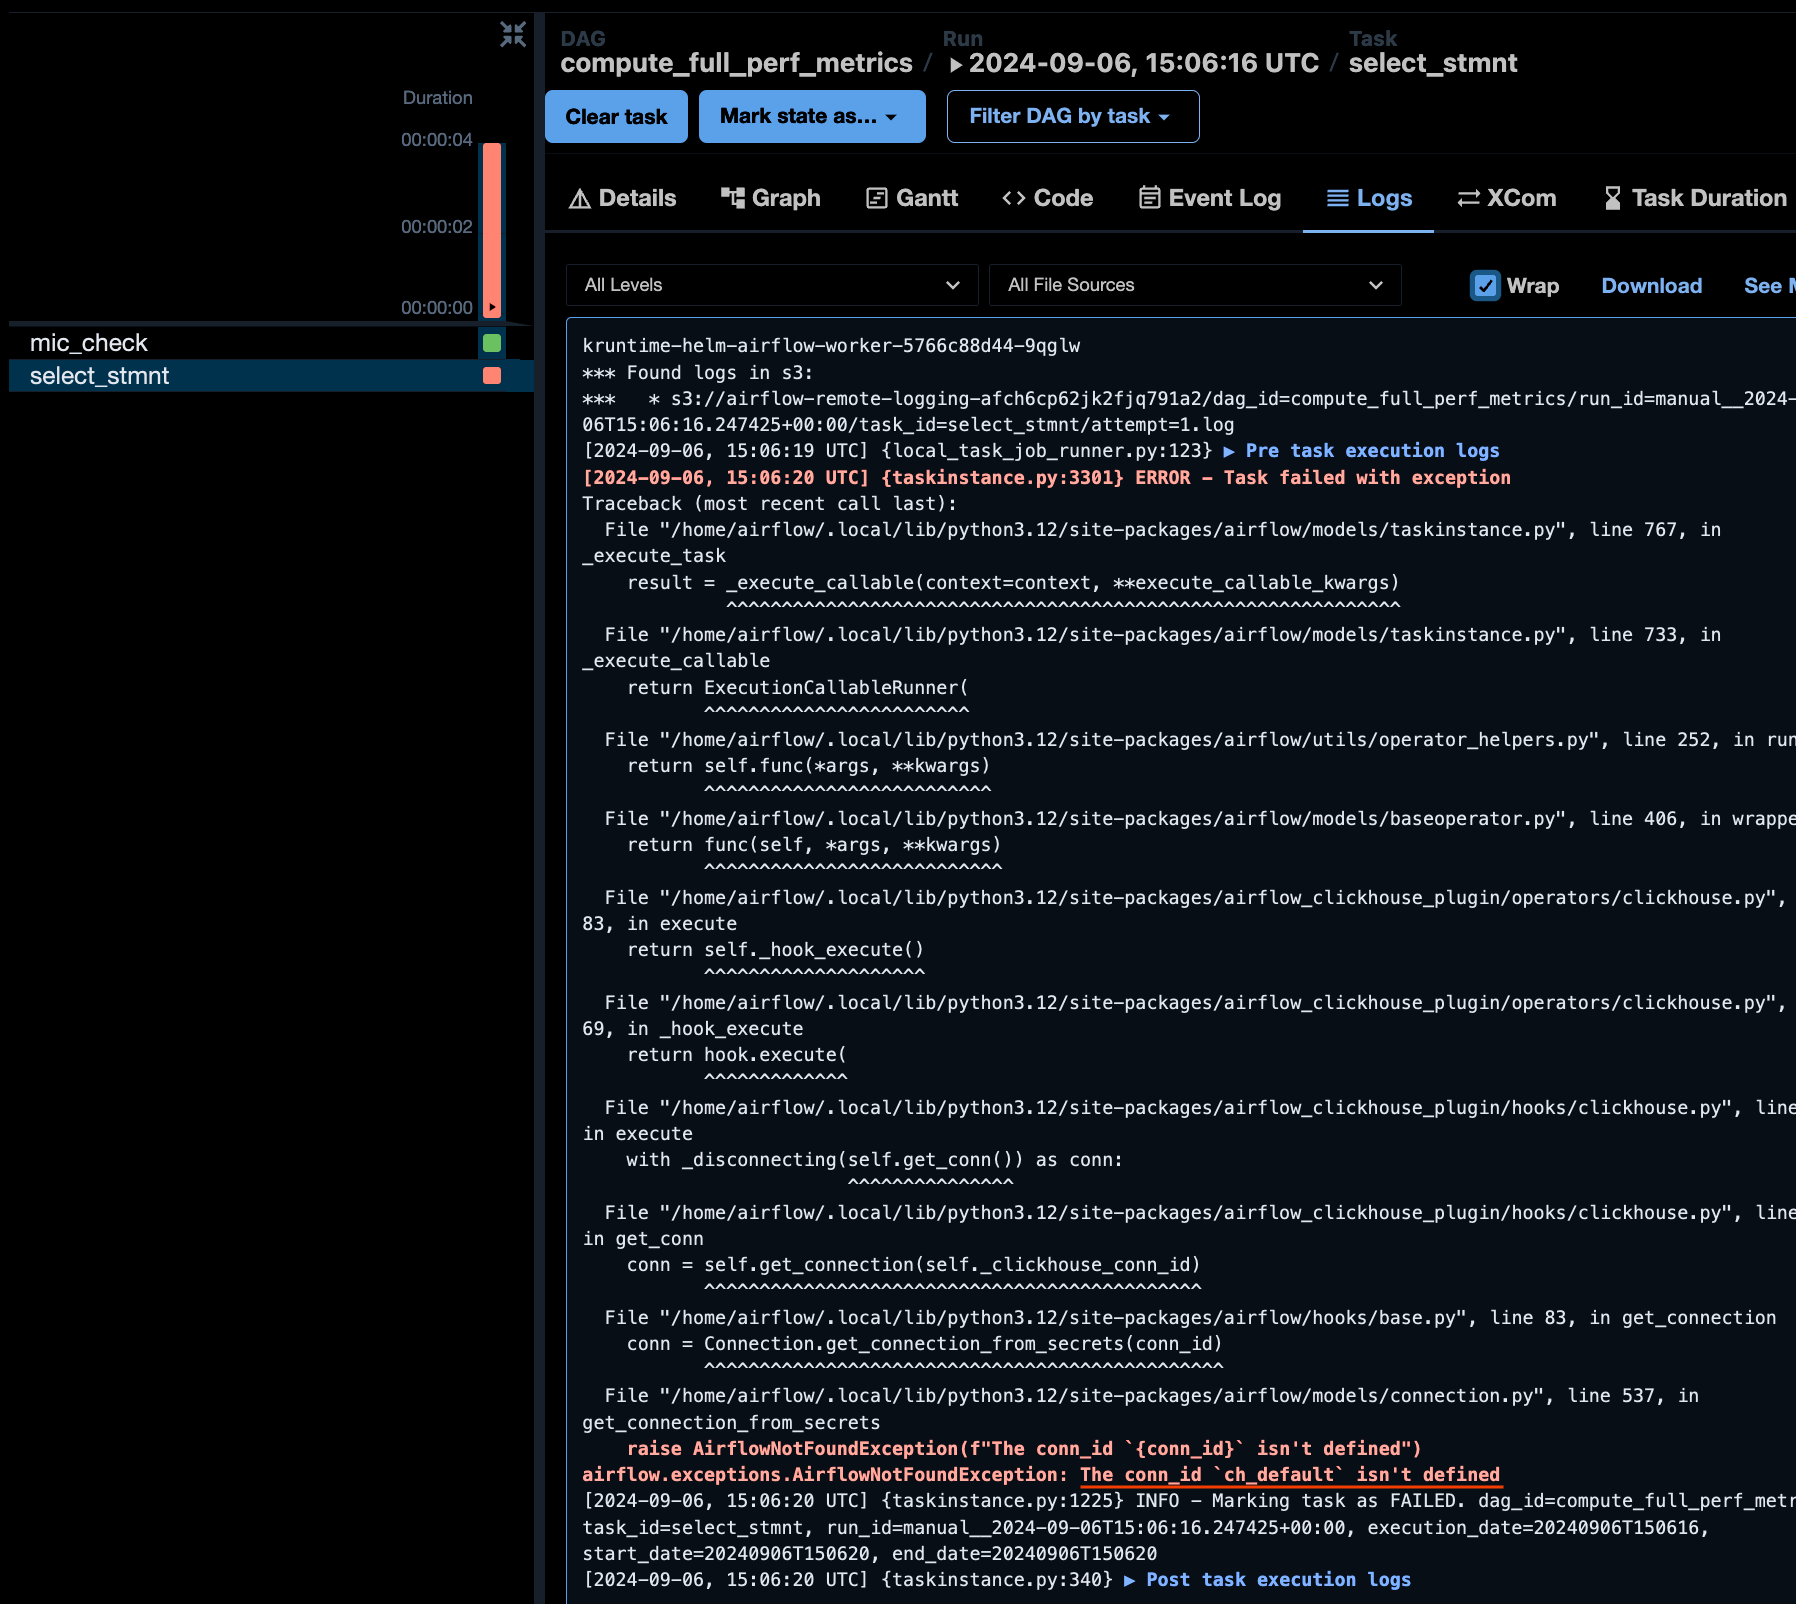
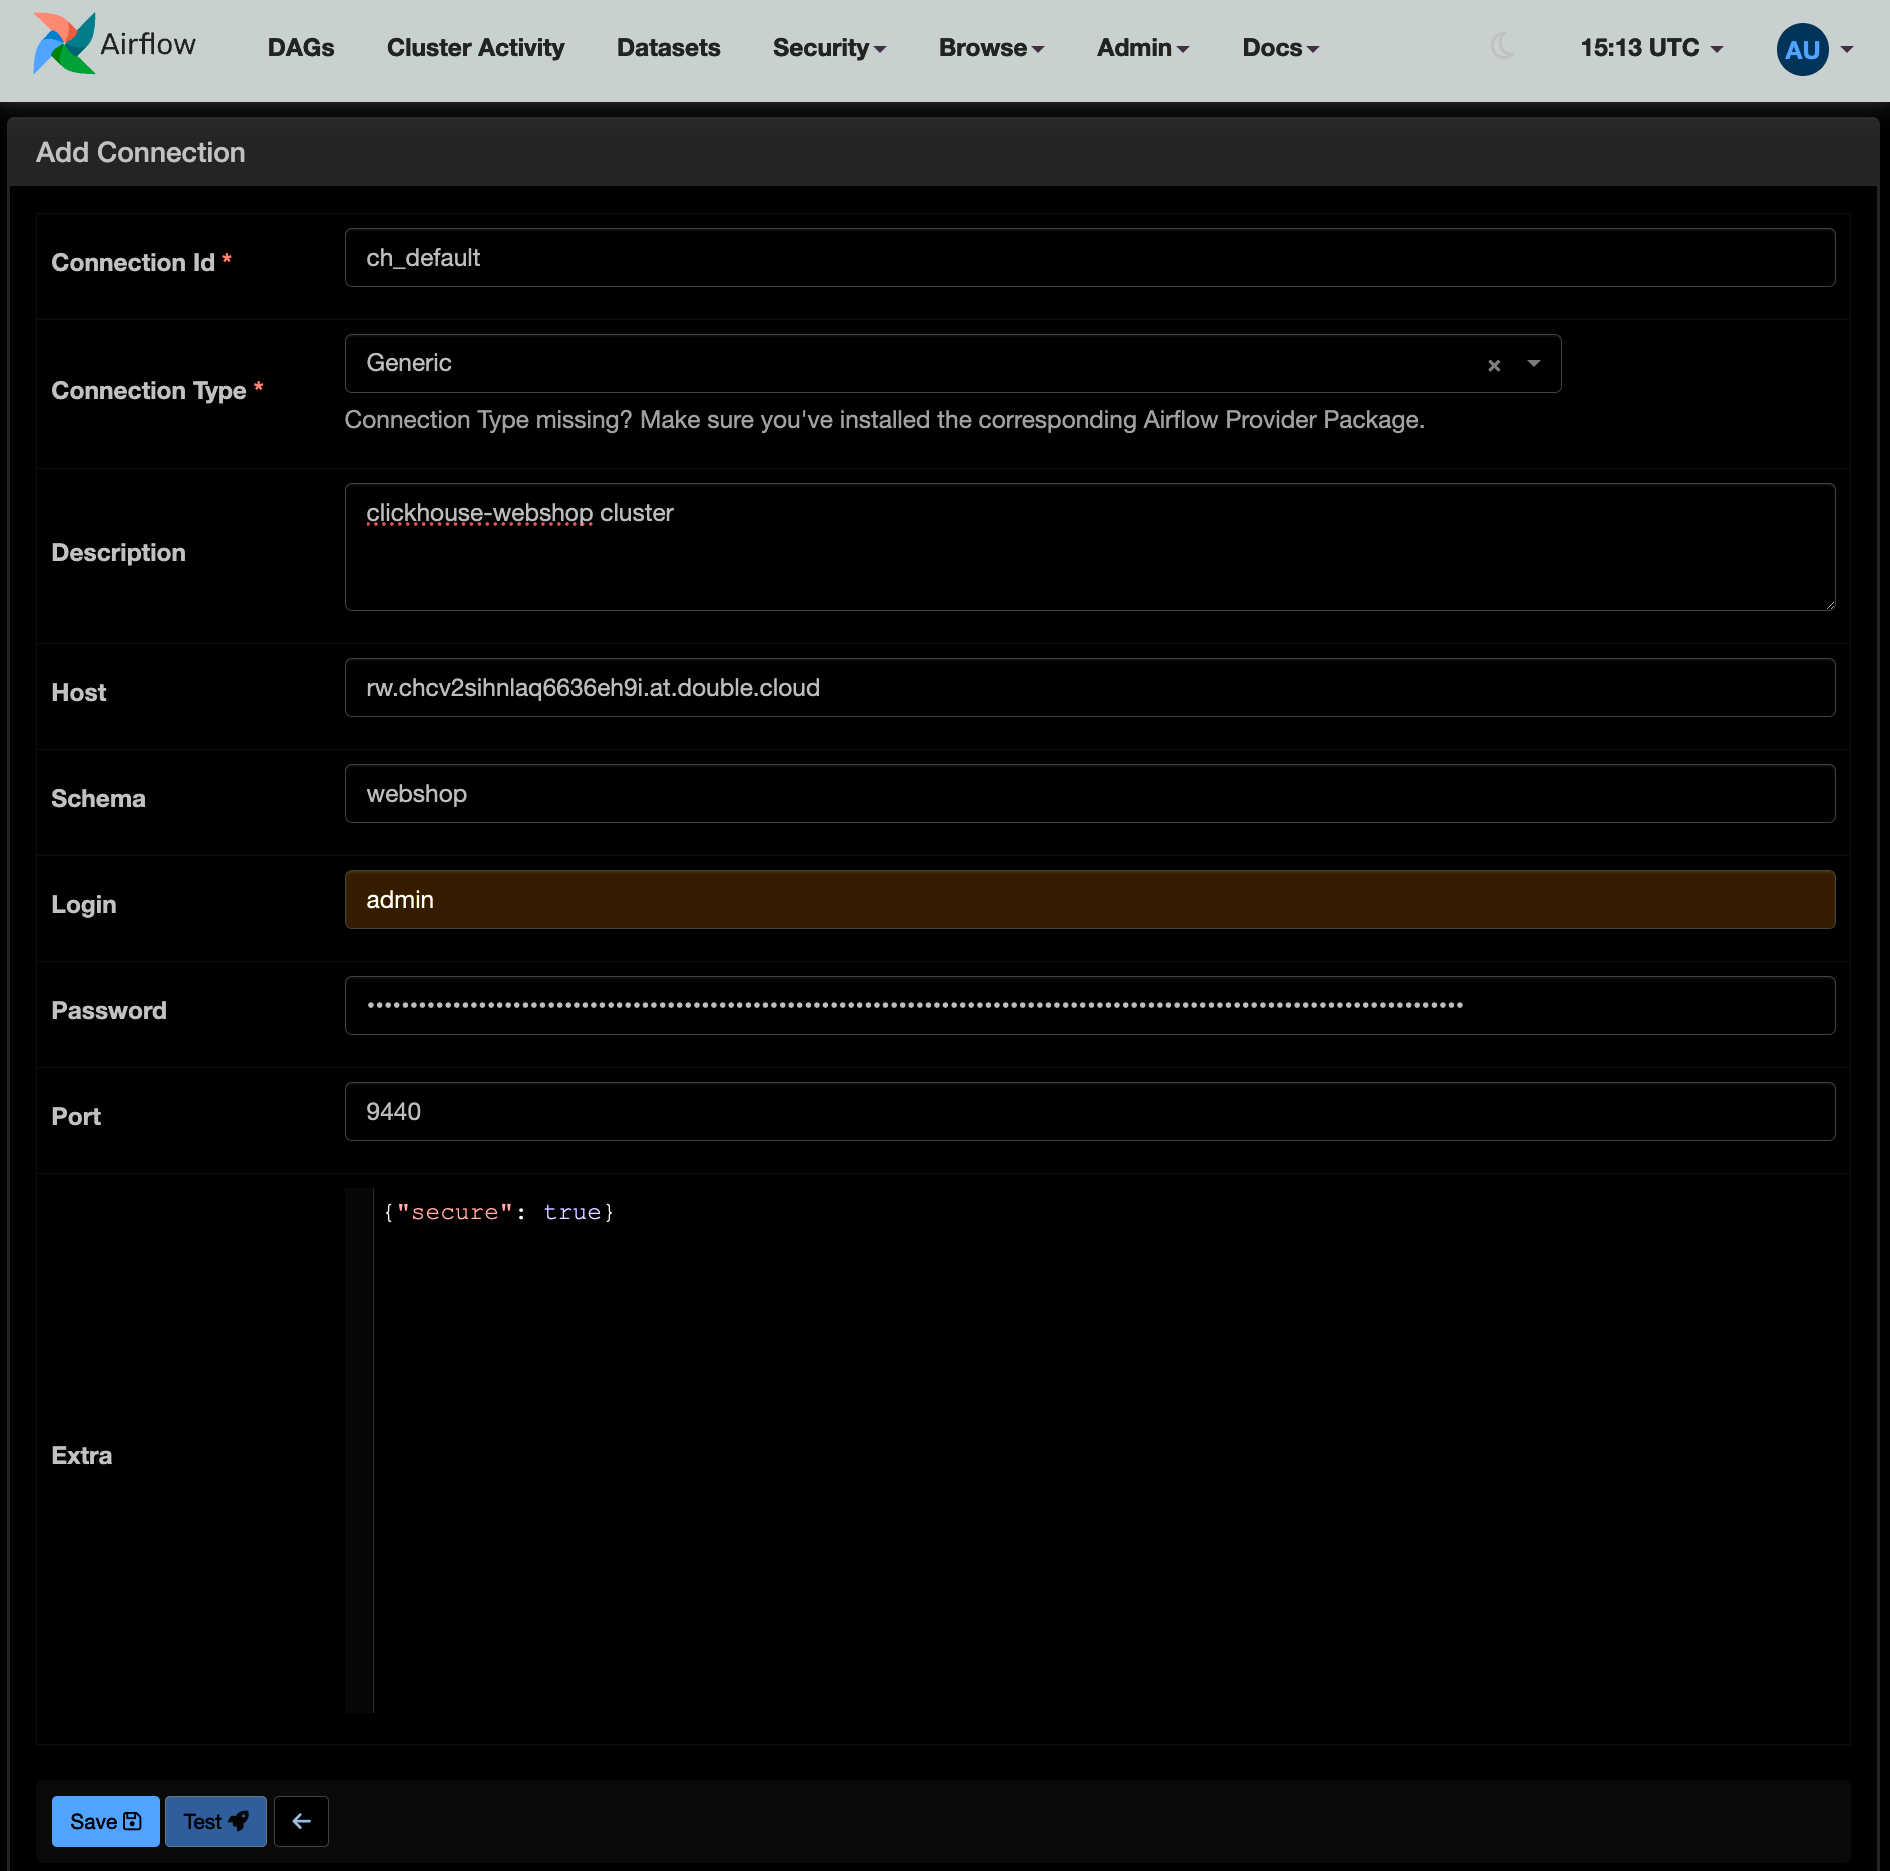
It all can be fixed by creating a connection. Go to Admin->Connections and add a Generic connection using credentials for your ClickHouse server:
-
Connection id:
ch_default -
Connection type:
Generic -
Set host, port, and login/password accordingly
-
Specify schema:
webshop(this will be used as our database) -
Add {”
secure”: true} to extra settings. This is required for DoubleCloud because your data is always secure with us — we just need to tell Airflow about it!
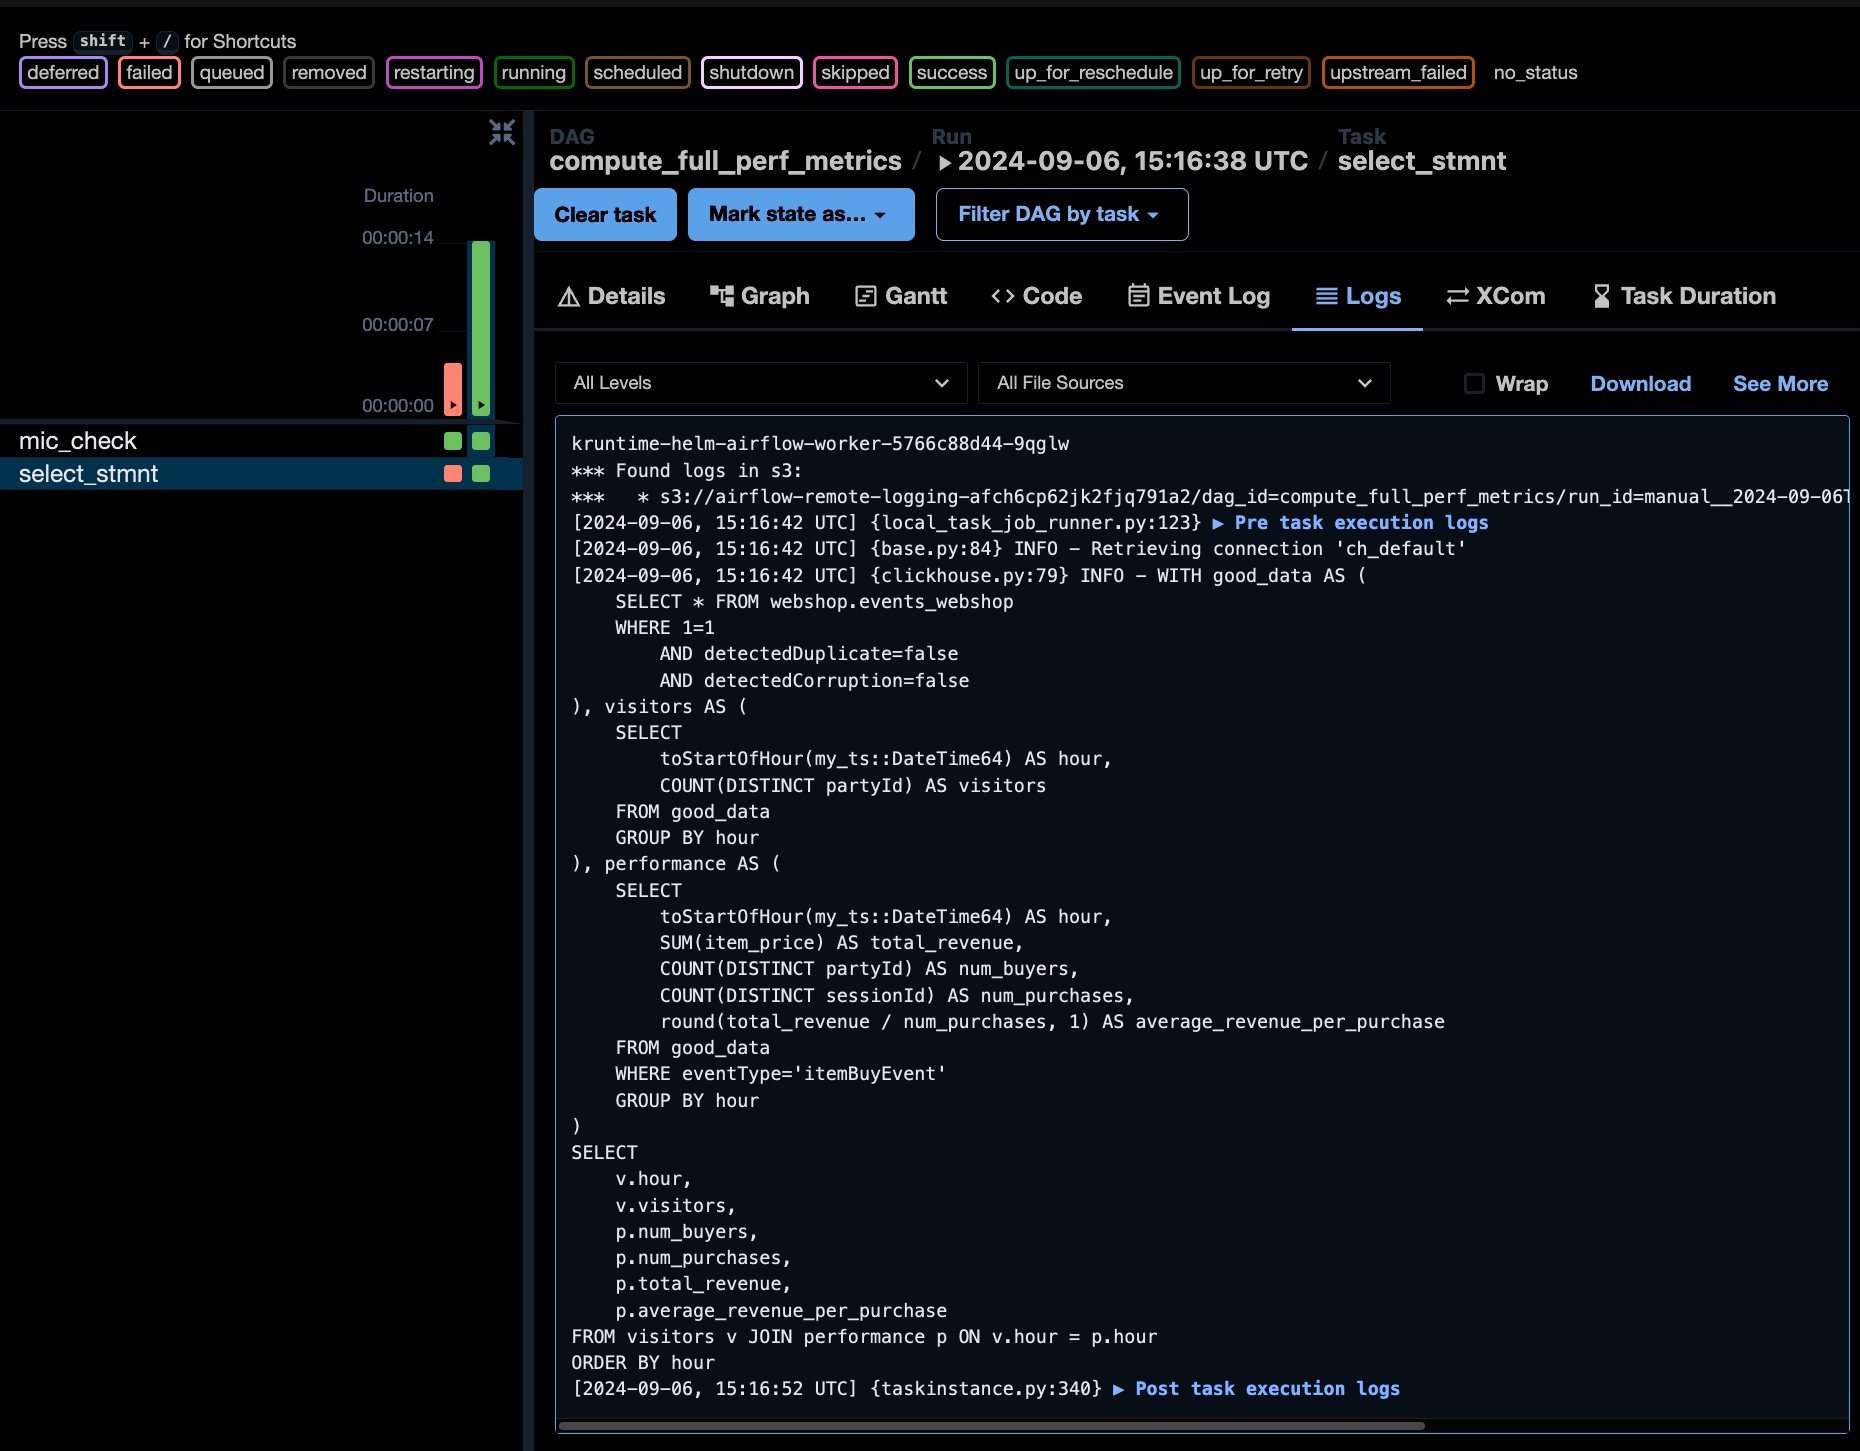
Now, triggering our ClickHouse DAG again should result in a successful run. The log will show you the executed query:
The query result is saved in the XCom tab. I’ve collapsed a few rows, but it’s semantically the same result as in the WebSQL:
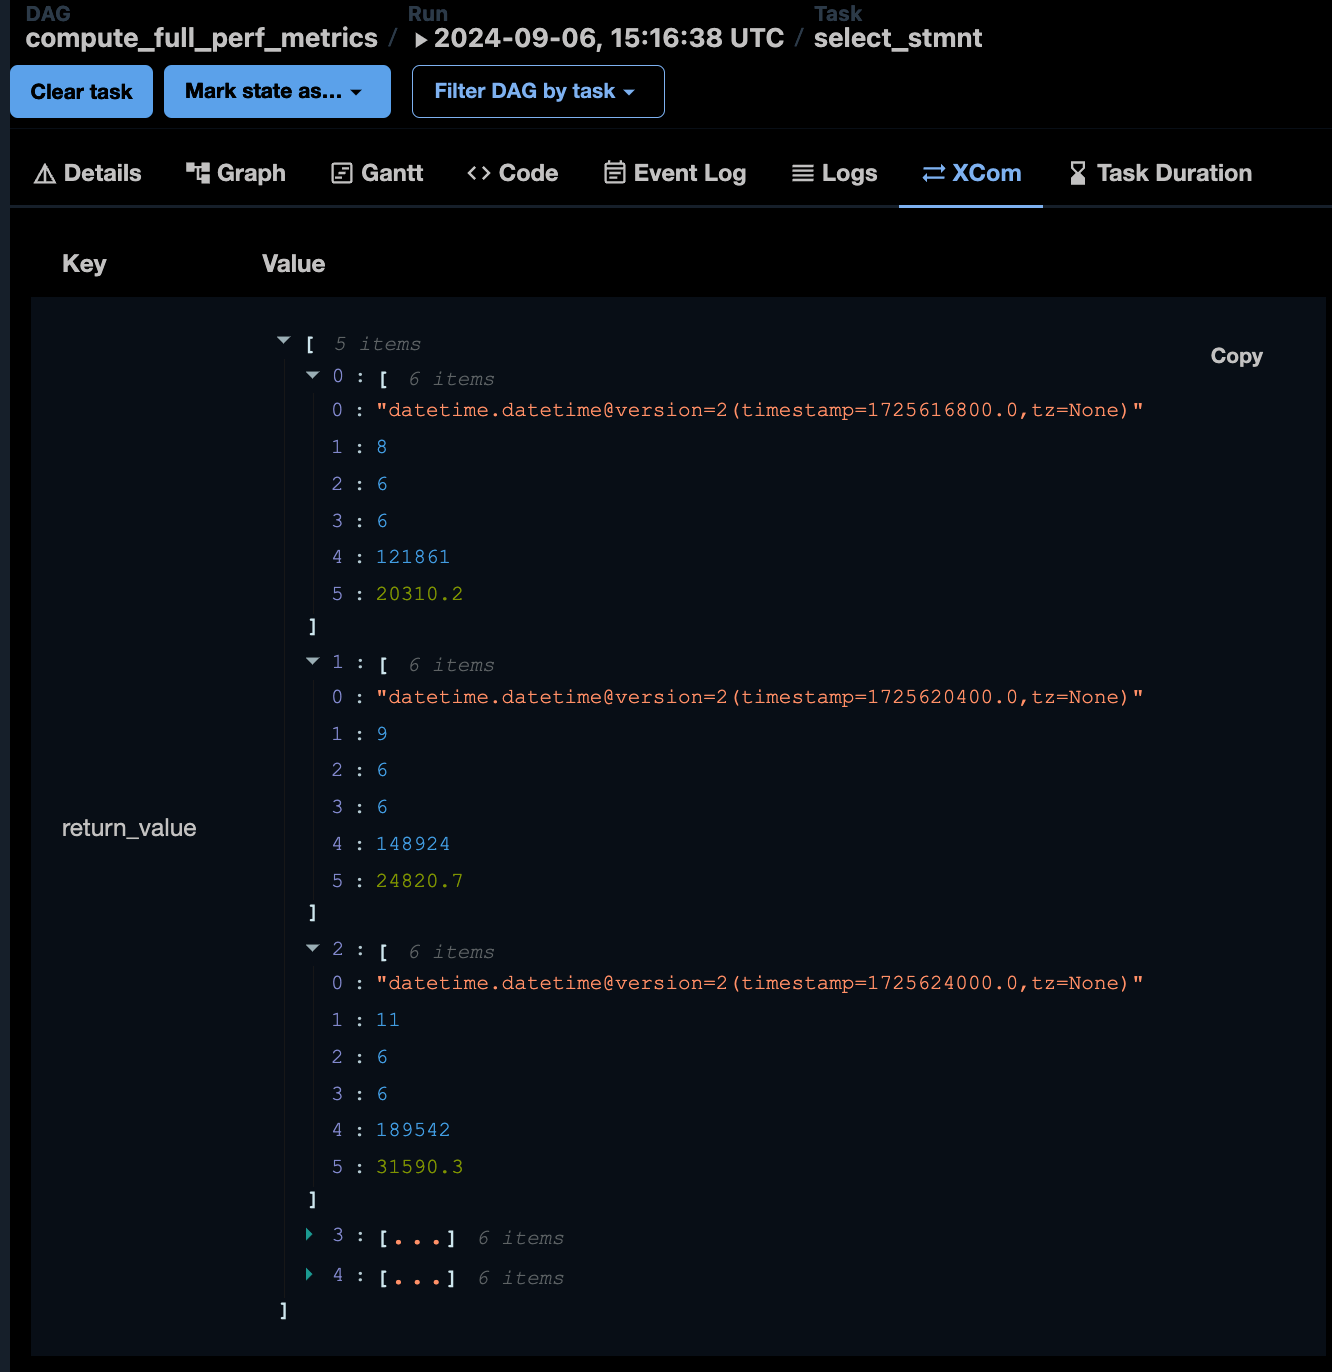
This confirms that our Airflow cluster can now interact with the ClickHouse cluster and compute the necessary metrics. However, this setup isn’t ideal yet:
1. The DAG is not idempotent (we’ll address this in the next part of the series).
2. The results are only saved in the Airflow metadata, not a persistent location, not in ClickHouse, hard to access, etc
Let’s address the second point by modifying our DAG structure to save results in a table.
Changing DAG structure
Let’s modify the pipeline structure to address the issue of result persistence:
1. First, the pipeline will check if the target aggregation table exists
2. If it doesn’t exist, the pipeline should create the table and compute aggregations on all available data
3. If the table exists, the pipeline will truncate it and insert new data
This pipeline isn’t ideal for production use as it has a few obvious drawbacks, but it demonstrates how to write an Airflow pipeline with additional SQL-based checks. I’ll discuss pipeline improvements and query performance in the next part of this series.
Additional table
For our aggregates data mart, let’s use the following structure:
CREATE TABLE IF NOT EXISTS performance_aggregates (
    ts_start DateTime,
    ts_end DateTime,
    visitors Integer,
    num_buyers Integer,
    num_purchases Integer,
    total_revenue Integer,
    average_revenue_per_purchase Float32
) ENGINE = MergeTree() PRIMARY KEY ts_start
This structure is similar to what we’ve used before, with an additional column for the end of the interval. The MergeTree engine is suitable for our test sample, but for production use, you should always first check if you can use more specific engine type.
To insert data into this table, I will slightly modify me existing query by adding an INSERT INTO statement:
INSERT INTO webshop.performance_aggregates
  (ts_start, ts_end, total_revenue, num_buyers, visitors, total_revenue, average_revenue_per_purchase)
WITH good_data AS (
  …
Full query code can be found here. It’s worth noting that this approach has some limitations and wouldn’t be ideal for a production environment. However, for our current goal of getting all the components working together, it’s sufficient.
In the next part of this series, we’ll address these limitations and discuss how to make the pipeline more robust and suitable for production use.
Adjusting Airflow DAG
Here’s my resulting pipeline structure:
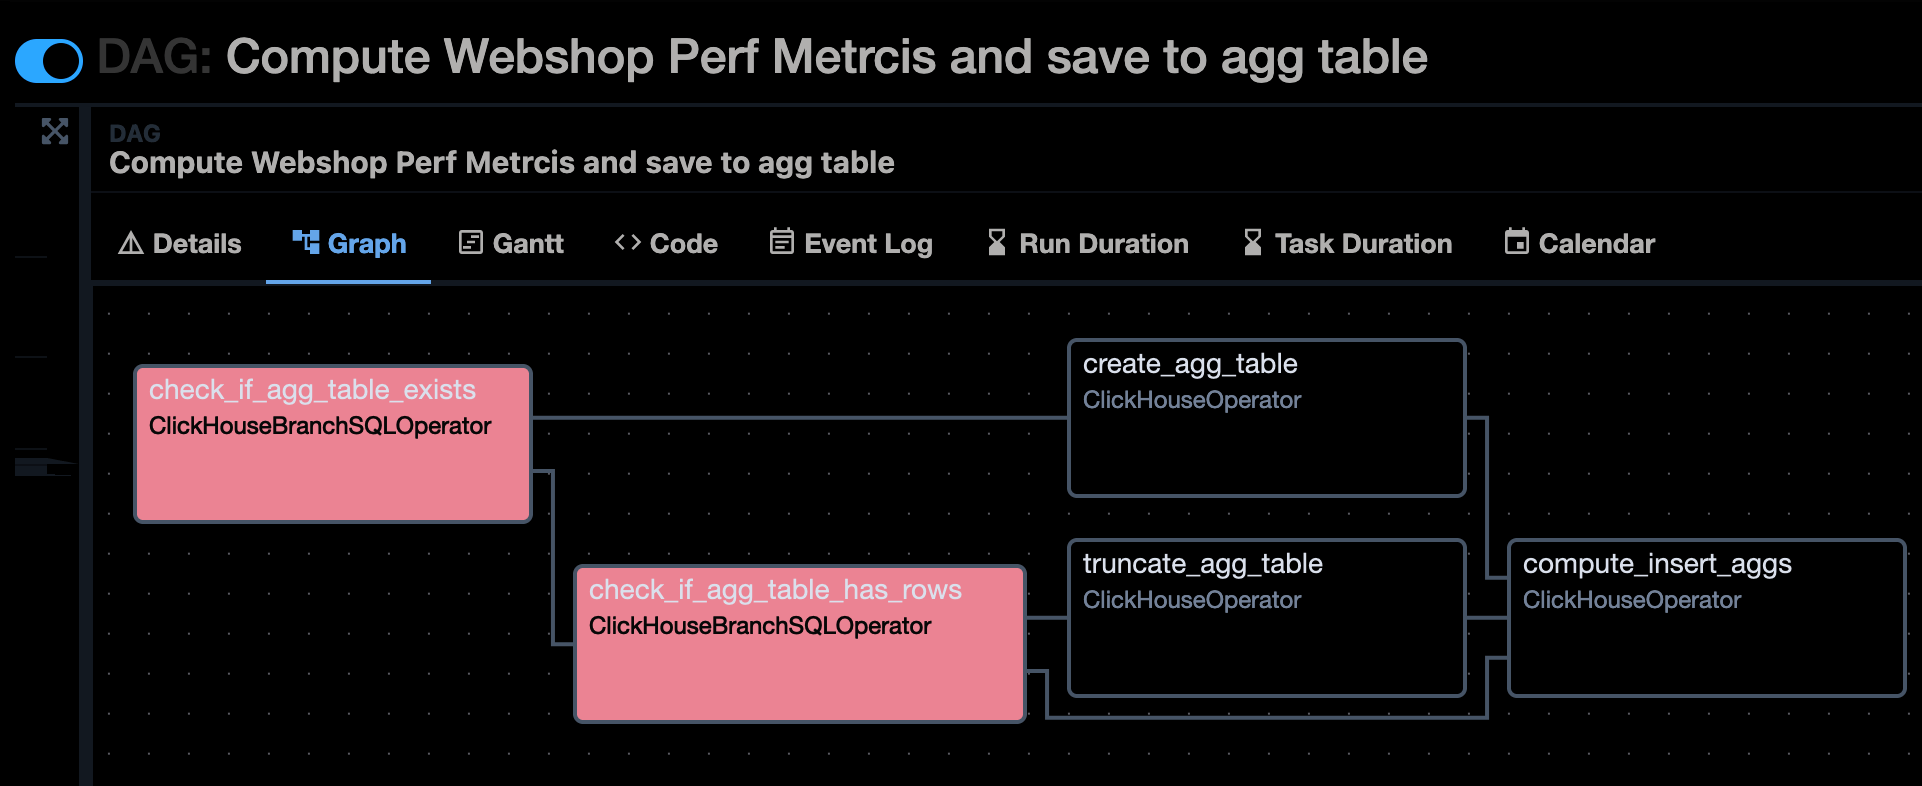
You can see the complete code in our repository.
I’d like to highlight some key points about this new DAG:
-
This DAG has no schedule. Since it computes across the whole table, it’s designed more for per-trigger use rather than scheduled runs.
-
While the DAG might seem verbose with some tasks that could be combined, this structure showcases how to author more complex DAGs. Tip: Airflow has a lesser-known feature that allows you to add text on top of edges, making complicated DAGs look cleaner. See here.
-
Given the nature of the overall process, I’ve limited the number of max active runs allowed for the DAG. This can be useful in certain scenarios when you expect multiple DAG runs triggered in a short period of time.
-
When implementing branching in Airflow, remember to set dependencies in the graph and keep task_ids naming consistent. Personally, I often start new DAGs with EmptyOperators to get the structure right before replacing them with real tasks.
-
It’s crucial to set the proper TriggerRule for the final task to ensure it’s not skipped when edges merge.
-
In the DAG code, I define a custom ClickHouseBranchSQLOperator instead of using the one provided by the airflow-clickhouse-plugin. This is due to some method resolution order (MRO) issue in Airflow versions < 2.9.3. You might not need this in newer versions (see docstring for details).
-
Some SQL statements could be hardcoded/inlined instead of reading from a file, but I prefer consistency and this a nice minor side-effect as it makes it easier to get feedback from SQL experts (they can just read an SQL file and not Python code + SQL statements).
-
Depending on your use-case, it might make sense to set table names as parameters or Airflow variables for easier modifications. I will cover it in the next part, along with scheduling, idempotency, and data_interval usage.
I want to emphasize that we’re focusing on using Airflow with our ClickHouse cluster data, not on production-ready code quality. I’d caution against using this DAG directly in production. However, it serves as a good starting point for developing your own DAGs that utilize ClickHouse.
Let’s trigger this DAG and check the results. Enabling the DAG and running it for the first time will create the table and compute the aggregations. Subsequent runs will use the other branch.

In the next part of this series, we’ll refine our approach and address some of the limitations in this initial implementation.
Final result
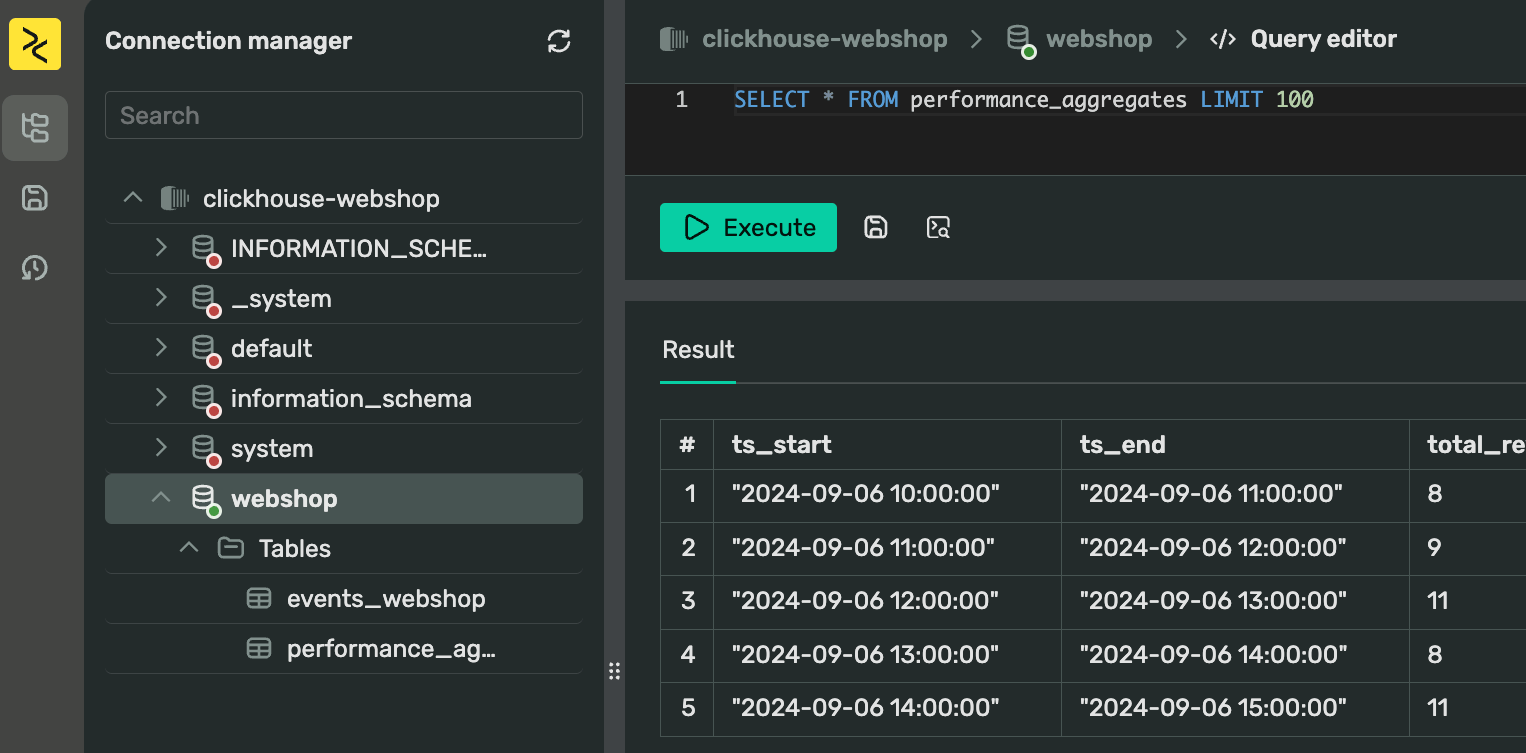
Switching to WebSQL I can now see my new table and query data from it:
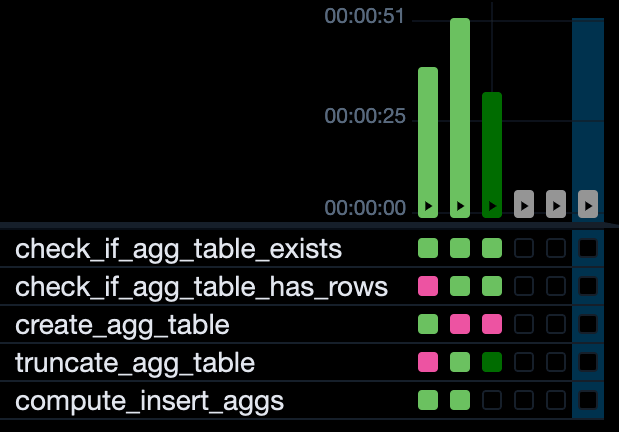
Running the DAG again would takes a different path in the graph. Since we limited the max active runs, multiple triggers won’t interfere with each other:
Everything seems to be working as expected. Let’s recap what we’ve accomplished:
1. We started by spinning up an Airflow cluster. My DAGs are stored in separate folder in a repository.
2. I did some Exploratory Data Analysis to determine what we wanted to compute and got our first working query in WebSQL. The fancy phrase basically means “I’ve ran some queries to check what’s up with my data”. This helped me understand my data better and prepare for automation in Airflow. By saving queries as SQL files in my DAGs folder, I can later easily reuse them.
3. Using ClickHouseOperator in Airflow, I’ve set up a simple DAG that runs the query as-is. This helped me ensure everything is working fine from connectivity standpoint.
4. I’ve added a few additional steps to my DAG that create the aggregation table and save the result, allowing me to rerun it whenever needed.
This is a point in our imaginary communication with the data client where I can now present these results to data analysts and gather feedback on either the SQL queries or the data mart structure. It’s a good place to wrap up this part of our series.
Looking ahead to part III
In the next installment of this series, we’re going to take our analytics platform to the next level:
1. We’ll build an interactive dashboard using the DoubleCloud Visualization tool, bringing our data to life visually.
2. We’ll shorten the time bucket for more granular analysis and utilize a bigger dataset to stress-test our system.
3. We’ll refine our DAG, addressing improvements such as:
- Implementing idempotency
- Setting up proper scheduling
- Making our pipeline more robust for production use
- Parametrizing table names and leveraging Airflow variables for increased flexibility
4. We’ll explore how this entire setup can be deployed using Terraform, streamlining the infrastructure-as-code process.
5. We’ll also cover different table structures and approaches for this problem and how different ClickHouse engines can be used here, and if we indeed need to use something different than the basic MergeTree for optimizing this analytics pipeline.
Remember, while our current implementation works, it’s designed as a learning exercise. For production environments, if you were going with self-hosted solutions, you’d need to implement additional error handling, logging, and performance optimizations. However, with DoubleCloud, many of these issues are solved for you, allowing you to focus on your data processing needs instead.
Thanks for joining us on this journey so far. Stay tuned for part III, where we’ll bring all these pieces together into a comprehensive, production-grade analytics solution! If you have any questions or would like to discuss this series further, feel free to reach out on Slack. DoubleCloud is always here to help you make the most of your data!
Get started with DoubleCloud


