DoubleCloud’s 8th product update
Hey everyone, Victor here. Here’s the news I’ve got for this month:
In Preview: Google Cloud Support
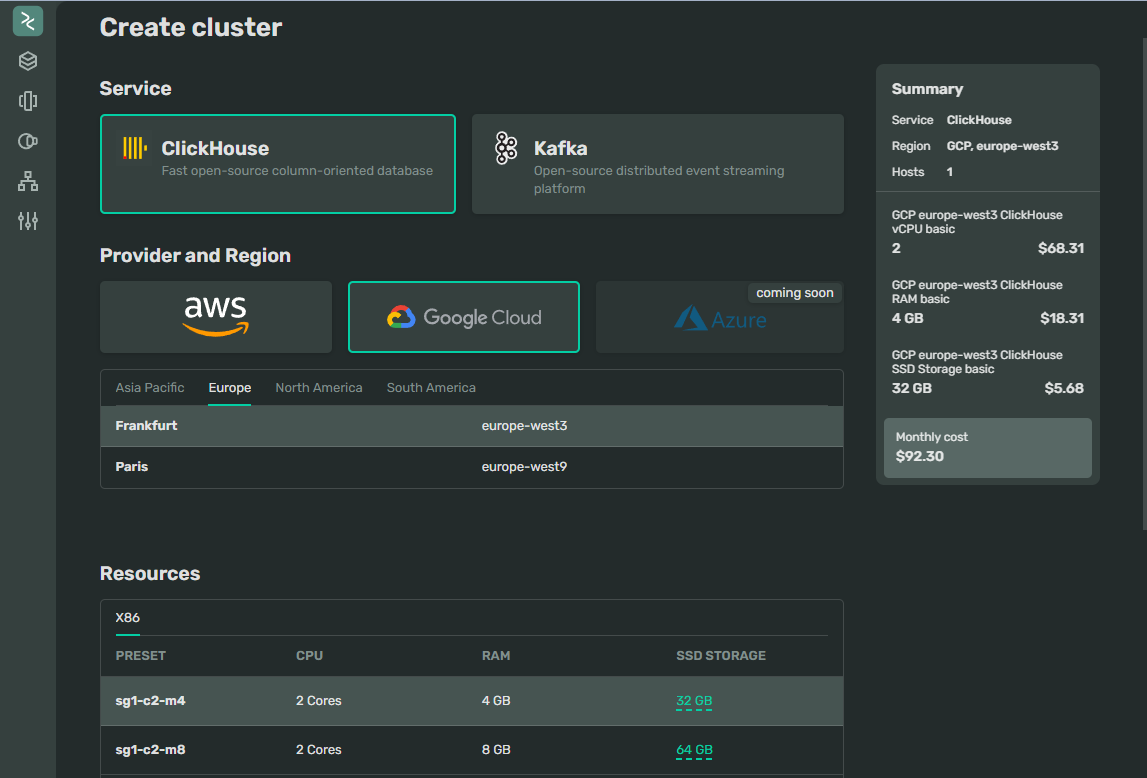
As part of our commitment to providing a cloud-agnostic, open-source, end-to-end analytics platform, we are excited to announce the preview launch of Google Cloud support. This offers a seamless experience for users since they only need to select their preferred cloud provider when creating Clickhouse or Apache Kafka clusters on DoubleCloud.
In our benchmark tests comparing Clickhouse speed on AWS and GCP, we noted an impressive 30% performance boost on GCP. This significant improvement is largely due to the AMD Milan architecture and the higher-performing network disk options we’ve started using. Importantly, AMD Milan instances are more widely available across GCP regions, enabling us to utilize them in our targeted areas as a default option.
Given that GCP’s prices are approximately 10% lower, users could potentially see a total price performance decrease of around 40%.

You can expect the same functionalities that we offer on AWS, including support for Google Cloud Storage for hybrid storage in Clickhouse, backups, VPC peering with your GCP account, and many other features. Please note that these services are available in seven regions during the preview, and we plan to gradually increase the number of regions as we approach general availability.
To request access, simply fill out the form that appears when you select the Google Cloud option while creating a new cluster here.
We are now certified for SOC 2 Type 1, ISO 27017, and ISO 27018
At DoubleCloud, protecting your data is our top priority. We’re excited to announce that we have achieved additional certifications that demonstrate our commitment to data privacy and security. We are proud to be officially certified for SOC 2 Type 1, ISO/IEC 27017:2015, and ISO/IEC 27018:2019. To learn more about our compliance certifications and access our Trust reports, please click here.

Apache Kafka schema registry as a service
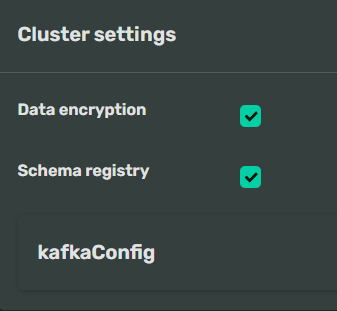
Now, you have the option to enable the schema registry functionality during the creation of an Apache Kafka cluster in DoubleCloud within the cluster settings. This feature will automatically deploy and host a schema registry on Kafka nodes via port 443. The schema registry facilitates “data contracts” between consumers and publishers using Kafka topics, thereby reducing data misinterpretation and decreasing issues that result from changes in data formats within your applications. More details on how to use this feature can be found here.

ElasticSearch DoubleCloud Transfer connector
We’ve noticed a consistent interest in optimizing ElasticSearch usage, particularly for analytical scenarios that involve calculating statistics based on data in ElasticSearch, as well as filtering and groupings. While ElasticSearch excels in search and full-text scenarios, it tends to lag behind Clickhouse significantly in terms of cost performance.
During one of our proofs of concept with a customer, we compared performance and were able to reduce query execution time from 20 seconds to less than 1 second! You can read more about that case study here. To facilitate easy migration for our users, we’ve added an ElasticSearch connector to our DoubleCloud Transfer service. You can use it to migrate your data to Clickhouse without any coding or hassle, and it includes automatic schema creation and data type definition.
Support of Clickhouse ver 23.4 and 23.5
We have incorporated Clickhouse versions 23.4 and 23.5 into our platform. The most notable improvements, and my personal favourites in these versions, are enhanced reading speed for parquet files, support for AzureBlobStorage, and query cache for production workloads.
DoubleCloud quality of life improvements
Here are some small but important changes that may improve your experience on our platform:
-
We have added port 443 in addition to port 8443 in Clickhouse clusters, improving compatibility with external services and restricted environments.
-
Now, you can also set up and activate Clickhouse internal log tables such as text_log or opentelemetry_span_log via API or directly from the console.
-
We have revised the logic of how empty selectors work on dashboards to increase transparency for the end user.
-
We have introduced the capability to display subtotals in pivot tables. Additionally, we’ve implemented changes that can be disabled if they affect usage behaviour, all manageable from the chart settings.
Start your trial today


