Analyze your {A|N}LB logs with ClickHouse
Written by: Andrei Tserakhau, DoubleCloud Tech Lead
Enabling the power of ClickHouse to consolidate logs offers a game-changing approach. It’s cost-effective, lightning-fast, and effortlessly scales to accommodate your needs.
AWS stores Load Balancer Logs in S3, employing a queue system for a seamless CDC (Change Data Capture) style delivery. This synergy between S3's queuing mechanism and ClickHouse lays a robust foundation for efficient log analysis. And DoubleCloud makes this even easier with the power of Transfer service.
With Terraform at your disposal, setting up log aggregation becomes a straightforward process.
Lay the groundwork
So, how do you build the essential components for a scalable and fast observability stack, dedicated to dissecting and understanding AWS NLB or ALB access logs?
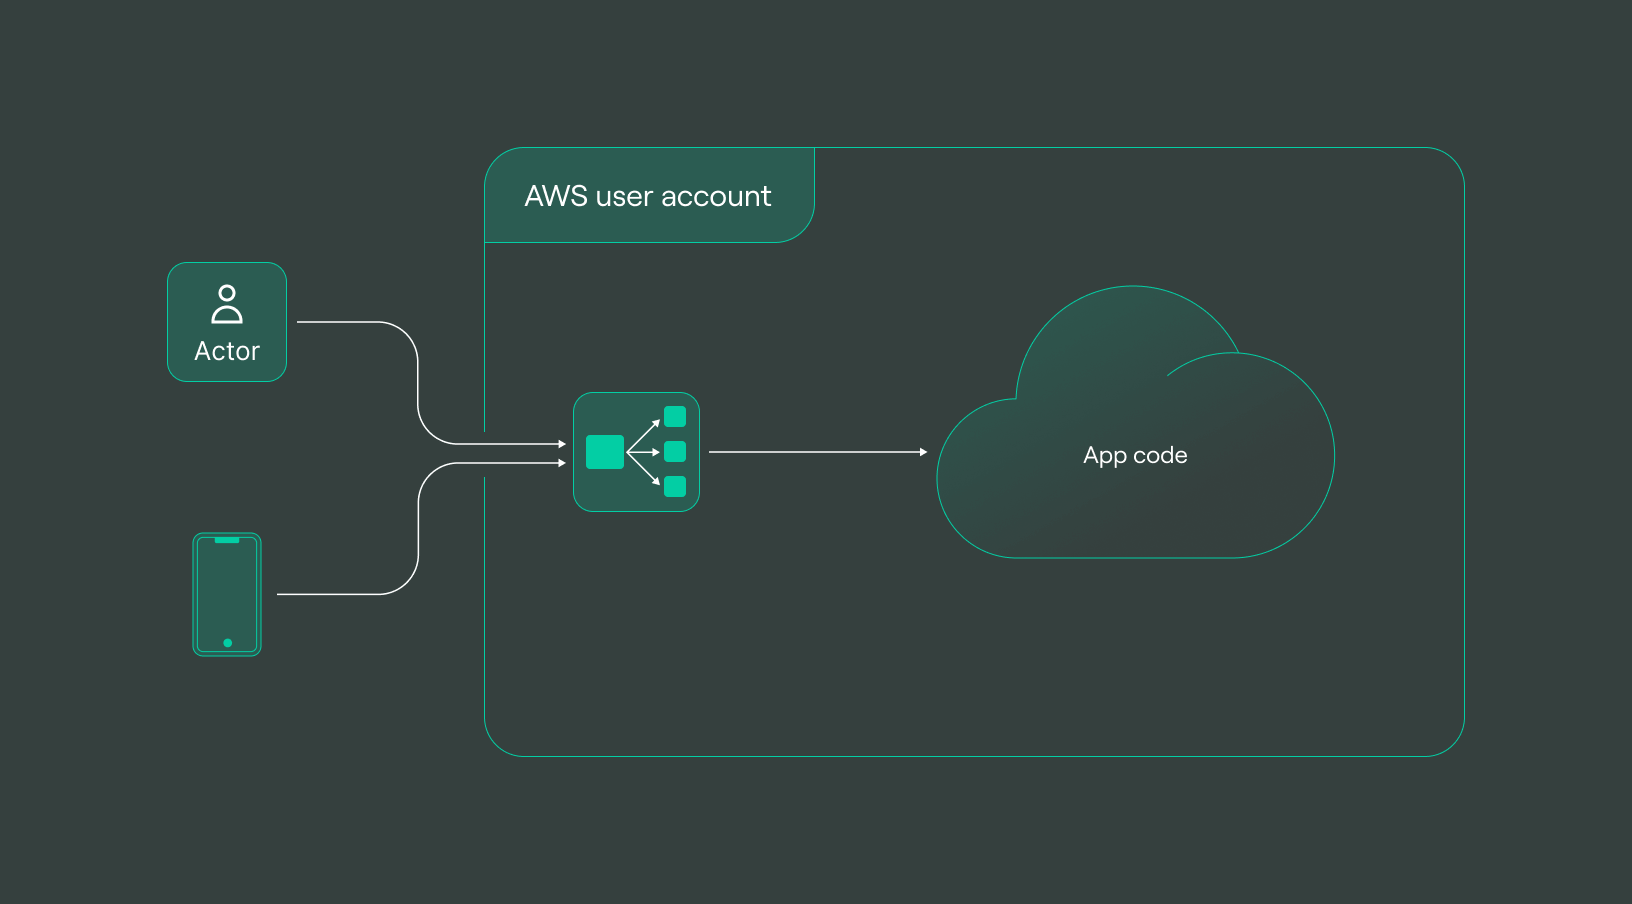
To set the stage, envision a baseline scenario — a typical application setup incorporating an AWS Load Balancer. As a fundamental part of AWS services, Load Balancers funnel logs into an S3 bucket. Now, let’s take a guided tour through the step-by-step process, unveiling how these essential load-balancer logs seamlessly become accessible for real-time analysis in ClickHouse, all orchestrated through Terraform.
But before we venture into the Terraform magic, it’s essential to picture the existing infrastructure and the pivotal Terraform code that configures the seamless interplay between S3 and SQS for the ALB.

S3 bucket where the logs are stored by AWS
At the outset, our priority is setting up log storage for your ALB, a crucial step that involves binding an S3 bucket to your existing ALB.
Let’s kick off with the foundational element: the creation of an S3 Bucket.
Click to view an example on Github
resource "aws_s3_bucket" "nlb_logs" {
  bucket = var.bucket_name
}
This snippet lays the groundwork by creating an S3 bucket dedicated to storing ALB logs, thereby serving as a repository for AWS ALB logs.
resource "aws_lb" "alb" {
  /* your config
  */

  dynamic "access_logs" {
    for_each = var.access_logs_bucket != null ? { enabled = true } : {}

    content {
      enabled = true
      bucket  = var.bucket_name
      prefix  = var.access_logs_bucket_prefix
    }
  }
}
Now, let’s move forward with setting up the necessary configuration for an SQS queue to complement this S3 bucket.
Click to view an example on Github
resource "aws_sqs_queue" "nlb_logs_queue" {
  name   = var.sqs_name
  policy = <<POLICY
{
  "Version": "2012-10-17",
  "Id": "sqspolicy",
  "Statement": [
    {
      "Effect": "Allow",
      "Principal": "*",
      "Action": "sqs:SendMessage",
      "Resource": "arn:aws:sqs:*:*:${var.sqs_name}",
      "Condition": {
        "ArnEquals": { "aws:SourceArn": "${aws_s3_bucket.nlb_logs.arn}" }
      }
    }
  ]
}
POLICY
}
This code initiates the creation of an SQS queue, facilitating the seamless delivery of ALB logs to the designated S3 bucket.
As logs are delivered, they are automatically organized within a dedicated folder:

Regularly generated new log files demand a streamlined approach for notification and processing. To establish a seamless notification channel, we’ll configure an optimal push notification system via SQS. Referencing the guidelines outlined in Amazon S3's notification configuration documentation, our next step involves the creation of an SQS queue. This queue will serve as the conduit for receiving timely notifications, ensuring prompt handling and processing of newly generated log files within our S3 bucket.
This linkage is solidified through the creation of the SQS queue:
Click to view an example on Github
resource "aws_s3_bucket_notification" "nlb_logs_bucket_notification" {
  bucket = aws_s3_bucket.nlb_logs.id

  queue {
    queue_arn = aws_sqs_queue.nlb_logs_queue.arn
    events    = ["s3:ObjectCreated:*"]
  }
}
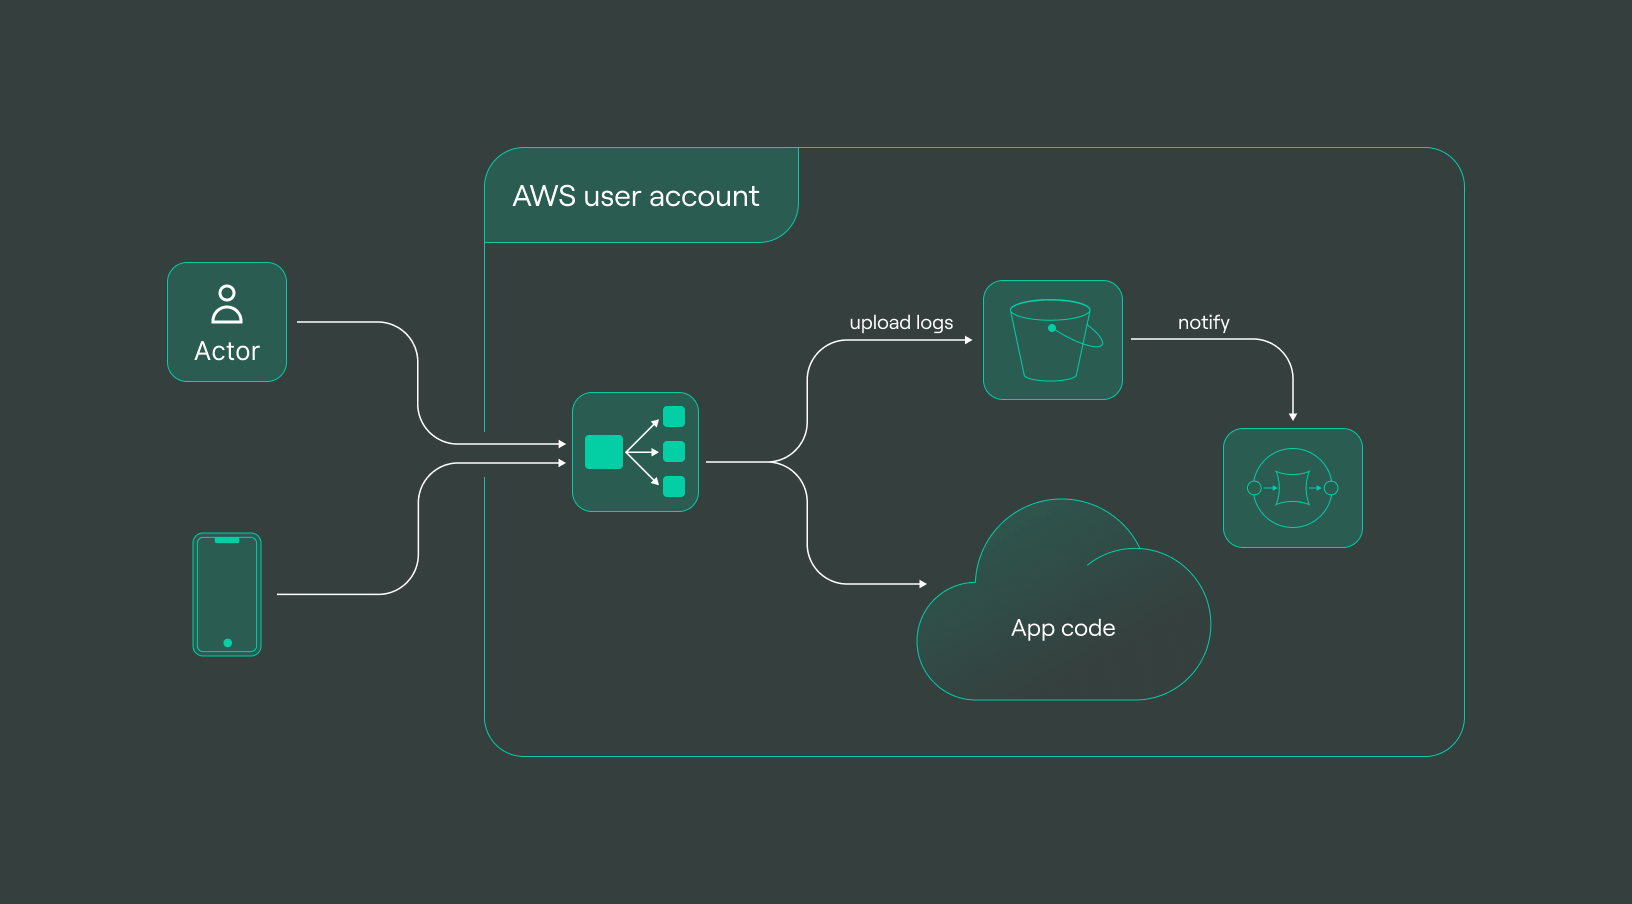
All the configurations implemented so far serve as the foundational infrastructure for streamlined log storage. From setting up the S3 bucket to configuring the SQS queue and establishing the intricate linkage between them, this orchestrated setup forms the backbone for efficient log management and processing:

The illustration above showcases the composed architecture, where the S3 bucket, SQS queue, and their interconnection stand as pivotal components for storing and managing logs effectively within the AWS environment.
Logs are now in your S3 bucket, but reading them may be challenging. Lets take a look at a data sample:
tls 2.0 2024-01-02T23:58:58 net/preprod-public-api-dt-tls/9f8794be28ab2534 4d9af2ddde90eb82 84.247.112.144:33342 10.0.223.207:443 244 121 0 15 - arn:aws:acm:eu-central-1:840525340941:certificate/5240a1e4-c7fe-44c1-9d89-c256213c5d23 - ECDHE-RSA-AES128-GCM-SHA256 tlsv12 - 18.193.17.109 - - "%ef%b5%bd%8" 2024-01-02T23:58:58
The snippet above represents a sample of the log data residing within the S3 bucket. Understanding data’s format and content will help us to build an efficient strategy to parse and store it.
Let’s move this data to DoubleCloud’s Managed ClickHouse.
Setup VPC and ClickHouse at DoubleCloud
Next, DoubleCloud comes to our rescue. We will add VPC (Virtual Private Cloud) and managed ClickHouse to serve as the dedicated storages for our logs.
Click to view an example on Github
resource "doublecloud_network" "nlb-network" {
  project_id      = var.project_id
  name            = var.network_name
  region_id       = var.region
  cloud_type      = var.cloud_type
  ipv4_cidr_block = var.ipv4_cidr
}
Let’s proceed by illustrating the integration of VPC and ClickHouse within this setup for our log storage. Let’s create an instance of ClickHouse within the VPC:
Click to view an example on Github
resource "doublecloud_clickhouse_cluster" "nlb-logs-clickhouse-cluster" {
  project_id = var.project_id
  name       = var.clickhouse_cluster_name
  region_id  = var.region
  cloud_type = var.cloud_type
  network_id = resource.doublecloud_network.nlb-network.id

  resources {
    clickhouse {
      resource_preset_id = var.clickhouse_cluster_resource_preset
      disk_size          = 34359738368
      replica_count      = 1
    }
  }

  config {
    log_level       = "LOG_LEVEL_INFORMATION"
    max_connections = 120
  }

  access {
    data_services = ["transfer"]
    ipv4_cidr_blocks = [
      {
        value       = var.ipv4_cidr
        description = "VPC CIDR"
      }
    ]
  }
}

data "doublecloud_clickhouse" "nlb-logs-clickhouse" {
  project_id = var.project_id
  id         = doublecloud_clickhouse_cluster.nlb-logs-clickhouse-cluster.id
}

Managed Service for ClickHouse
Fully managed service from the creators of the world’s 1st managed ClickHouse. Backups, 24/7 monitoring, auto-scaling, and updates.
Connect ClickHouse with S3 Logs via Transfer at DoubleCloud
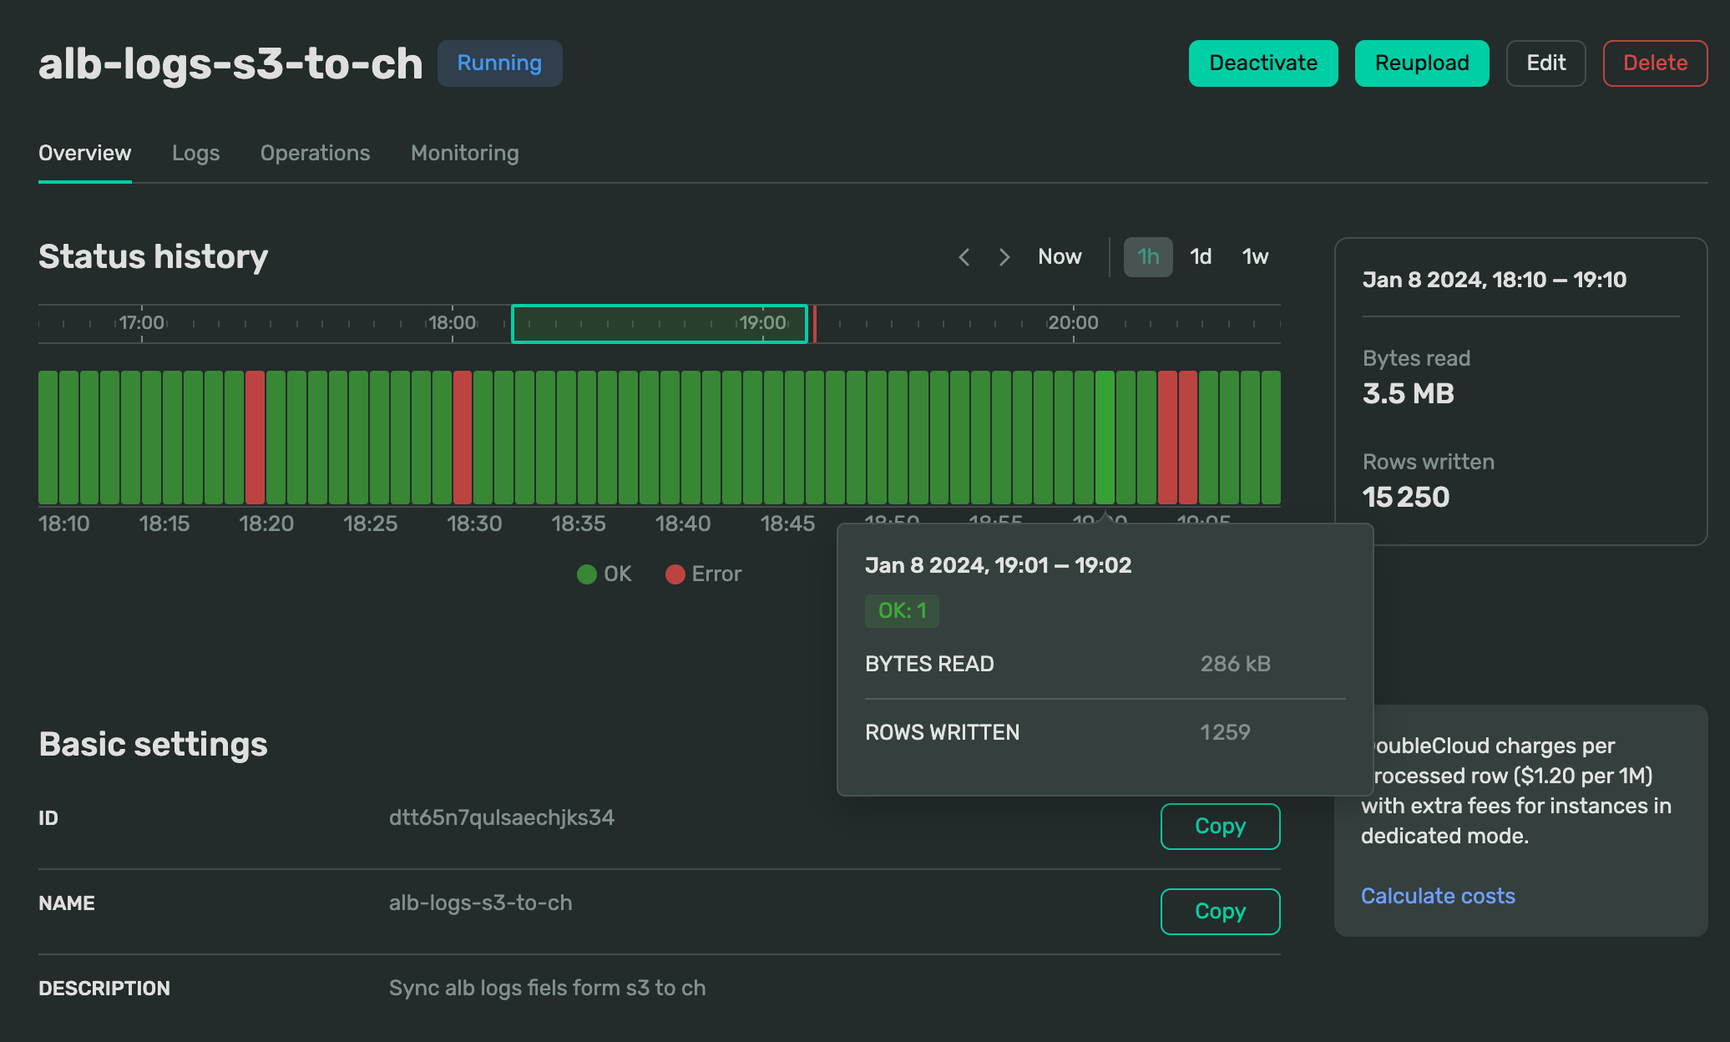
To connect S3 with ClickHouse, we’ll use DoubleCloud’s Transfer service, which is a powerful ELT tool.
Establishing a DoubleCloud Transfer (ELT pipeline) involves setting up a source and target endpoint. The Terraform code snippet below outlines the source endpoint:
Click to view an example on Github
resource "doublecloud_transfer_endpoint" "nlb-s3-s32ch-source" {
  name       = var.transfer_source_name
  project_id = var.project_id
  settings {
    object_storage_source {
      provider {
        bucket                = var.bucket_name
        path_prefix           = var.bucket_prefix
        aws_access_key_id     = var.aws_access_key_id
        aws_secret_access_key = var.aws_access_key_secret
        region                = var.region
        endpoint              = var.endpoint
        use_ssl               = true
        verify_ssl_cert       = true
      }
      format {
        csv {
          delimiter = " " // space as delimiter
          advanced_options {
          }
          additional_options {
          }
        }
      }
      event_source {
        sqs {
          queue_name = var.sqs_name
        }
      }
      result_table {
        add_system_cols = true
        table_name      = var.transfer_source_table_name
        table_namespace = var.transfer_source_table_namespace
      }
      result_schema {
        data_schema {
          fields {
            field {
              name     = "type"
              type     = "string"
              required = false
              key      = false
              path     = "0"
            }
            field {
              name     = "version"
              type     = "string"
              required = false
              key      = false
              path     = "1"
            }
            /*
              Rest of Fields
            */
            field {
              name     = "tls_connection_creation_time"
              type     = "datetime"
              required = false
              key      = false
              path     = "21"
            }
          }
        }
      }
    }
  }
}
This Terraform code snippet delineates the source endpoint configuration, encompassing S3 connection details, data format, event notifications using an SQS queue, and the schema definition for data stored within the S3 bucket.
Once we have a source, let’s make a target. It easier, since it’s just a ClickHouse:
Click to view an example on Github
resource "doublecloud_transfer_endpoint" "nlb-ch-s32ch-target" {
  name       = var.transfer_target_name
  project_id = var.project_id
  settings {
    clickhouse_target {
      clickhouse_cleanup_policy = "DROP"
      connection {
        address {
          cluster_id = doublecloud_clickhouse_cluster.nlb-logs-clickhouse-cluster.id
        }
        database = "default"
        password = data.doublecloud_clickhouse.nlb-logs-clickhouse.connection_info.password
        user     = data.doublecloud_clickhouse.nlb-logs-clickhouse.connection_info.user
      }
    }
  }
}
These two pieces can then be composed into a transfer:
Click to view an example on Github
resource "doublecloud_transfer" "nlb-logs-s32ch" {
  name       = var.transfer_name
  project_id = var.project_id
  source     = doublecloud_transfer_endpoint.nlb-s3-s32ch-source.id
  target     = doublecloud_transfer_endpoint.nlb-ch-s32ch-target.id
  type       = "INCREMENT_ONLY"
  activated  = false
}
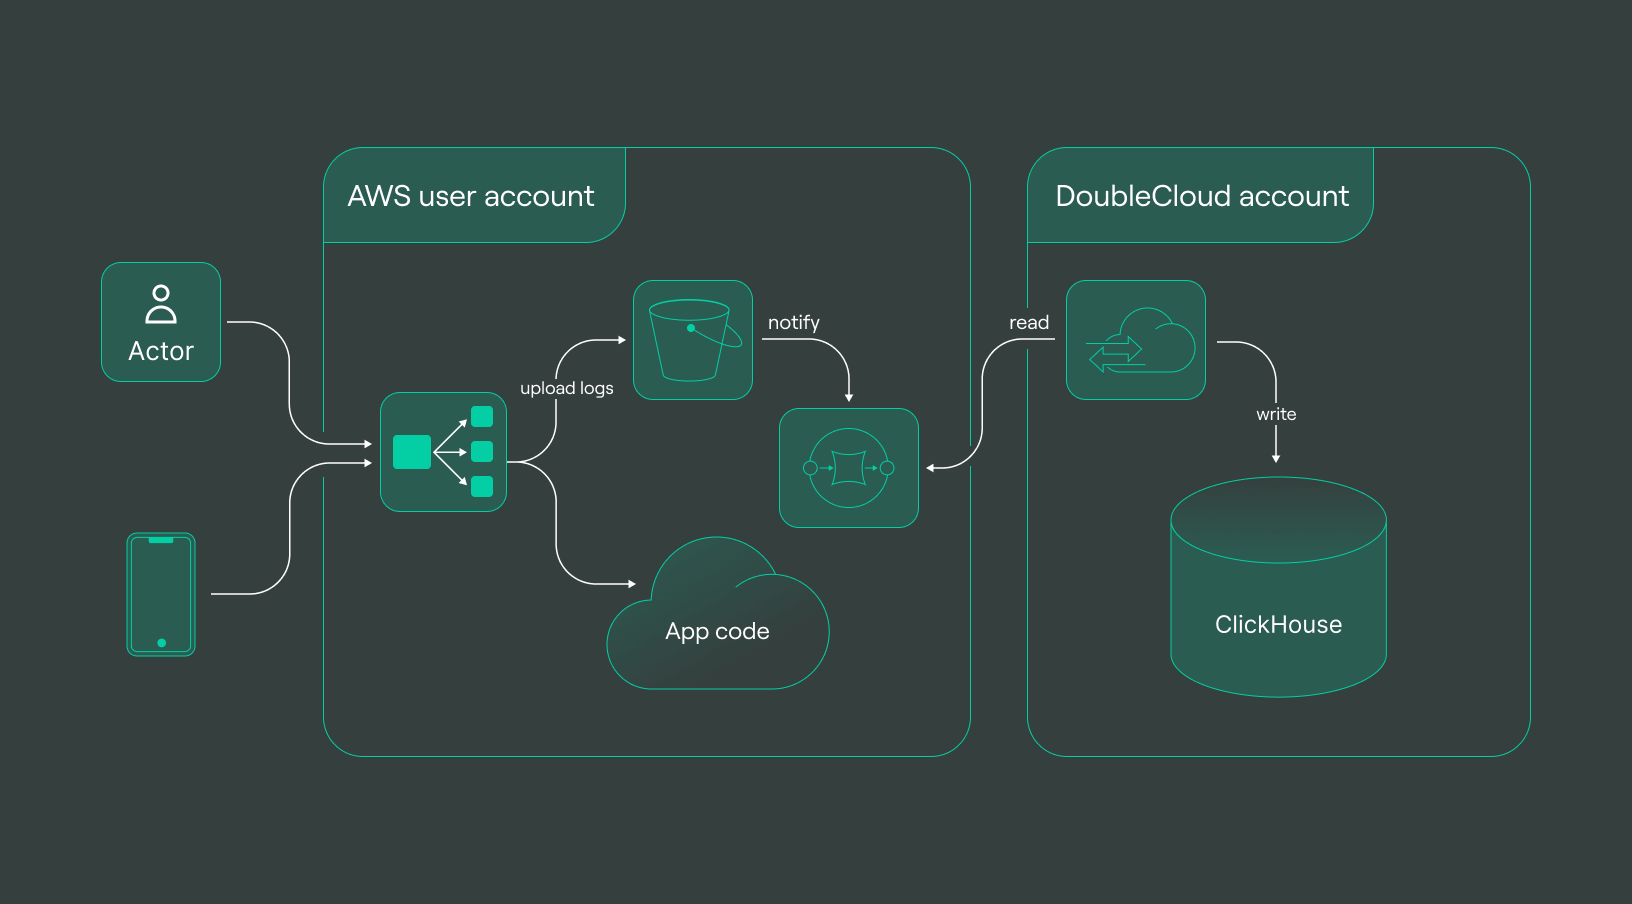
Once the transfer has been established, a comprehensive delivery pipeline takes shape:


No-code ELT tool: Data Transfer
A cloud agnostic service for aggregating, collecting, and migrating data from various sources.

The illustration above represents the culmination of our efforts — a complete delivery pipeline primed for seamless data flow. This integrated system, incorporating S3, SQS, VPC, ClickHouse, and the orchestrated configurations, stands ready to handle, process, and analyze log data efficiently and effectively at any scale.
Looking into logs
Now, it’s time to explore your data in ClickHouse. Let’s dive into querying your structured logs and uncover insights within this robustly organized dataset. To connect to your newly create DB you can use clickhouse-client:
clickhouse-client \\
  --host $CH_HOST \\
  --port 9440 \\
  --secure \\
  --user admin \\
  --password $CH_PASSWORD
Let’s start by getting an overview of the total count of logs. This simple query will provide us with an initial grasp of the volume of data we’re working on within our ClickHouse dataset:
SELECT count(*)
FROM logs_alb

Query id: 6cf59405-2a61-451b-9579-a7d340c8fd5c

┌──count()─┐
│ 15935887 │
└──────────┘

1 row in set. Elapsed: 0.457 sec.
Now, let’s zoom in and retrieve a specific row from our dataset. This targeted query will fetch a single record, allowing us to closely examine the details encapsulated within this individual log entry.
SELECT *
FROM logs_alb
LIMIT 1
FORMAT Vertical

Query id: 44fc6045-a5be-47e2-8482-3033efb58206

Row 1:
──────
type:                         tls
version:                      2.0
time:                         2023-11-20 21:05:01
elb:                          net/*****/*****
listener:                     92143215dc51bb35
client_port:                  10.0.246.57:55534
destination_port:             10.0.39.32:443
connection_time:              1
tls_handshake_time:           -
received_bytes:               0
sent_bytes:                   0
incoming_tls_alert:           -
chosen_cert_arn:              -
chosen_cert_serial:           -
tls_cipher:                   -
tls_protocol_version:         -
tls_named_group:              -
domain_name:                  -
alpn_fe_protocol:             -
alpn_be_protocol:             -
alpn_client_preference_list:  -
tls_connection_creation_time: 2023-11-20 21:05:01
__file_name:                  api/AWSLogs/******/elasticloadbalancing/eu-central-1/2023/11/20/****-central-1_net.****.log.gz
__row_index:                  1
__data_transfer_commit_time:  1700514476000000000
__data_transfer_delete_time:  0

1 row in set. Elapsed: 0.598 sec.
Time for a quick analysis: let’s execute a straightforward group by query to determine the most frequently used destination ports.
SELECT
    destination_port,
    count(*)
FROM logs_alb
GROUP BY destination_port

Query id: a4ab55db-9208-484f-b019-a5c13d779063

┌─destination_port──┬─count()─┐
│ 10.0.234.156:443  │   10148 │
│ 10.0.205.254:443  │   12639 │
│ 10.0.209.51:443   │   13586 │
│ 10.0.223.207:443  │   10125 │
│ 10.0.39.32:443    │ 4860701 │
│ 10.0.198.39:443   │   13837 │
│ 10.0.224.240:443  │    9546 │
│ 10.10.162.244:443 │  416893 │
│ 10.0.212.130:443  │    9955 │
│ 10.0.106.172:443  │ 4860359 │
│ 10.10.111.92:443  │  416908 │
│ 10.0.204.18:443   │    9789 │
│ 10.10.24.126:443  │  416881 │
│ 10.0.232.19:443   │   13603 │
│ 10.0.146.100:443  │ 4862200 │
└───────────────────┴─────────┘

15 rows in set. Elapsed: 1.101 sec. Processed 15.94 million rows, 405.01 MB (14.48 million rows/s., 368.01 MB/s.)
Explore the complete example in our Terraform project for a hands-on experience with log querying in ClickHouse.
Get started with DoubleCloud


