
Clickstream analytics case study. Part I: Kafka -> Data Transfer -> ClickHouse
Written By: Igor Mosyagin, Developer Advocate at DoubleCloud
Intro
Welcome to this series of posts exploring a real-time analytics use case. The series covers various aspects of setting up a real-time analytics platform using DoubleCloud managed services, from data ingestion to aggregation computation, and finally, to dashboards based on those data marts.
This first post focuses on the initial setup and data loading using ClickHouse, Apache Kafka, and DoubleCloud’s Data Transfer.
Data Solution overview
By the end of the series, we will have built a setup that enables us to ingest and make decisions based on clickstream data. The overall architecture of our data platform looks like this schematically:
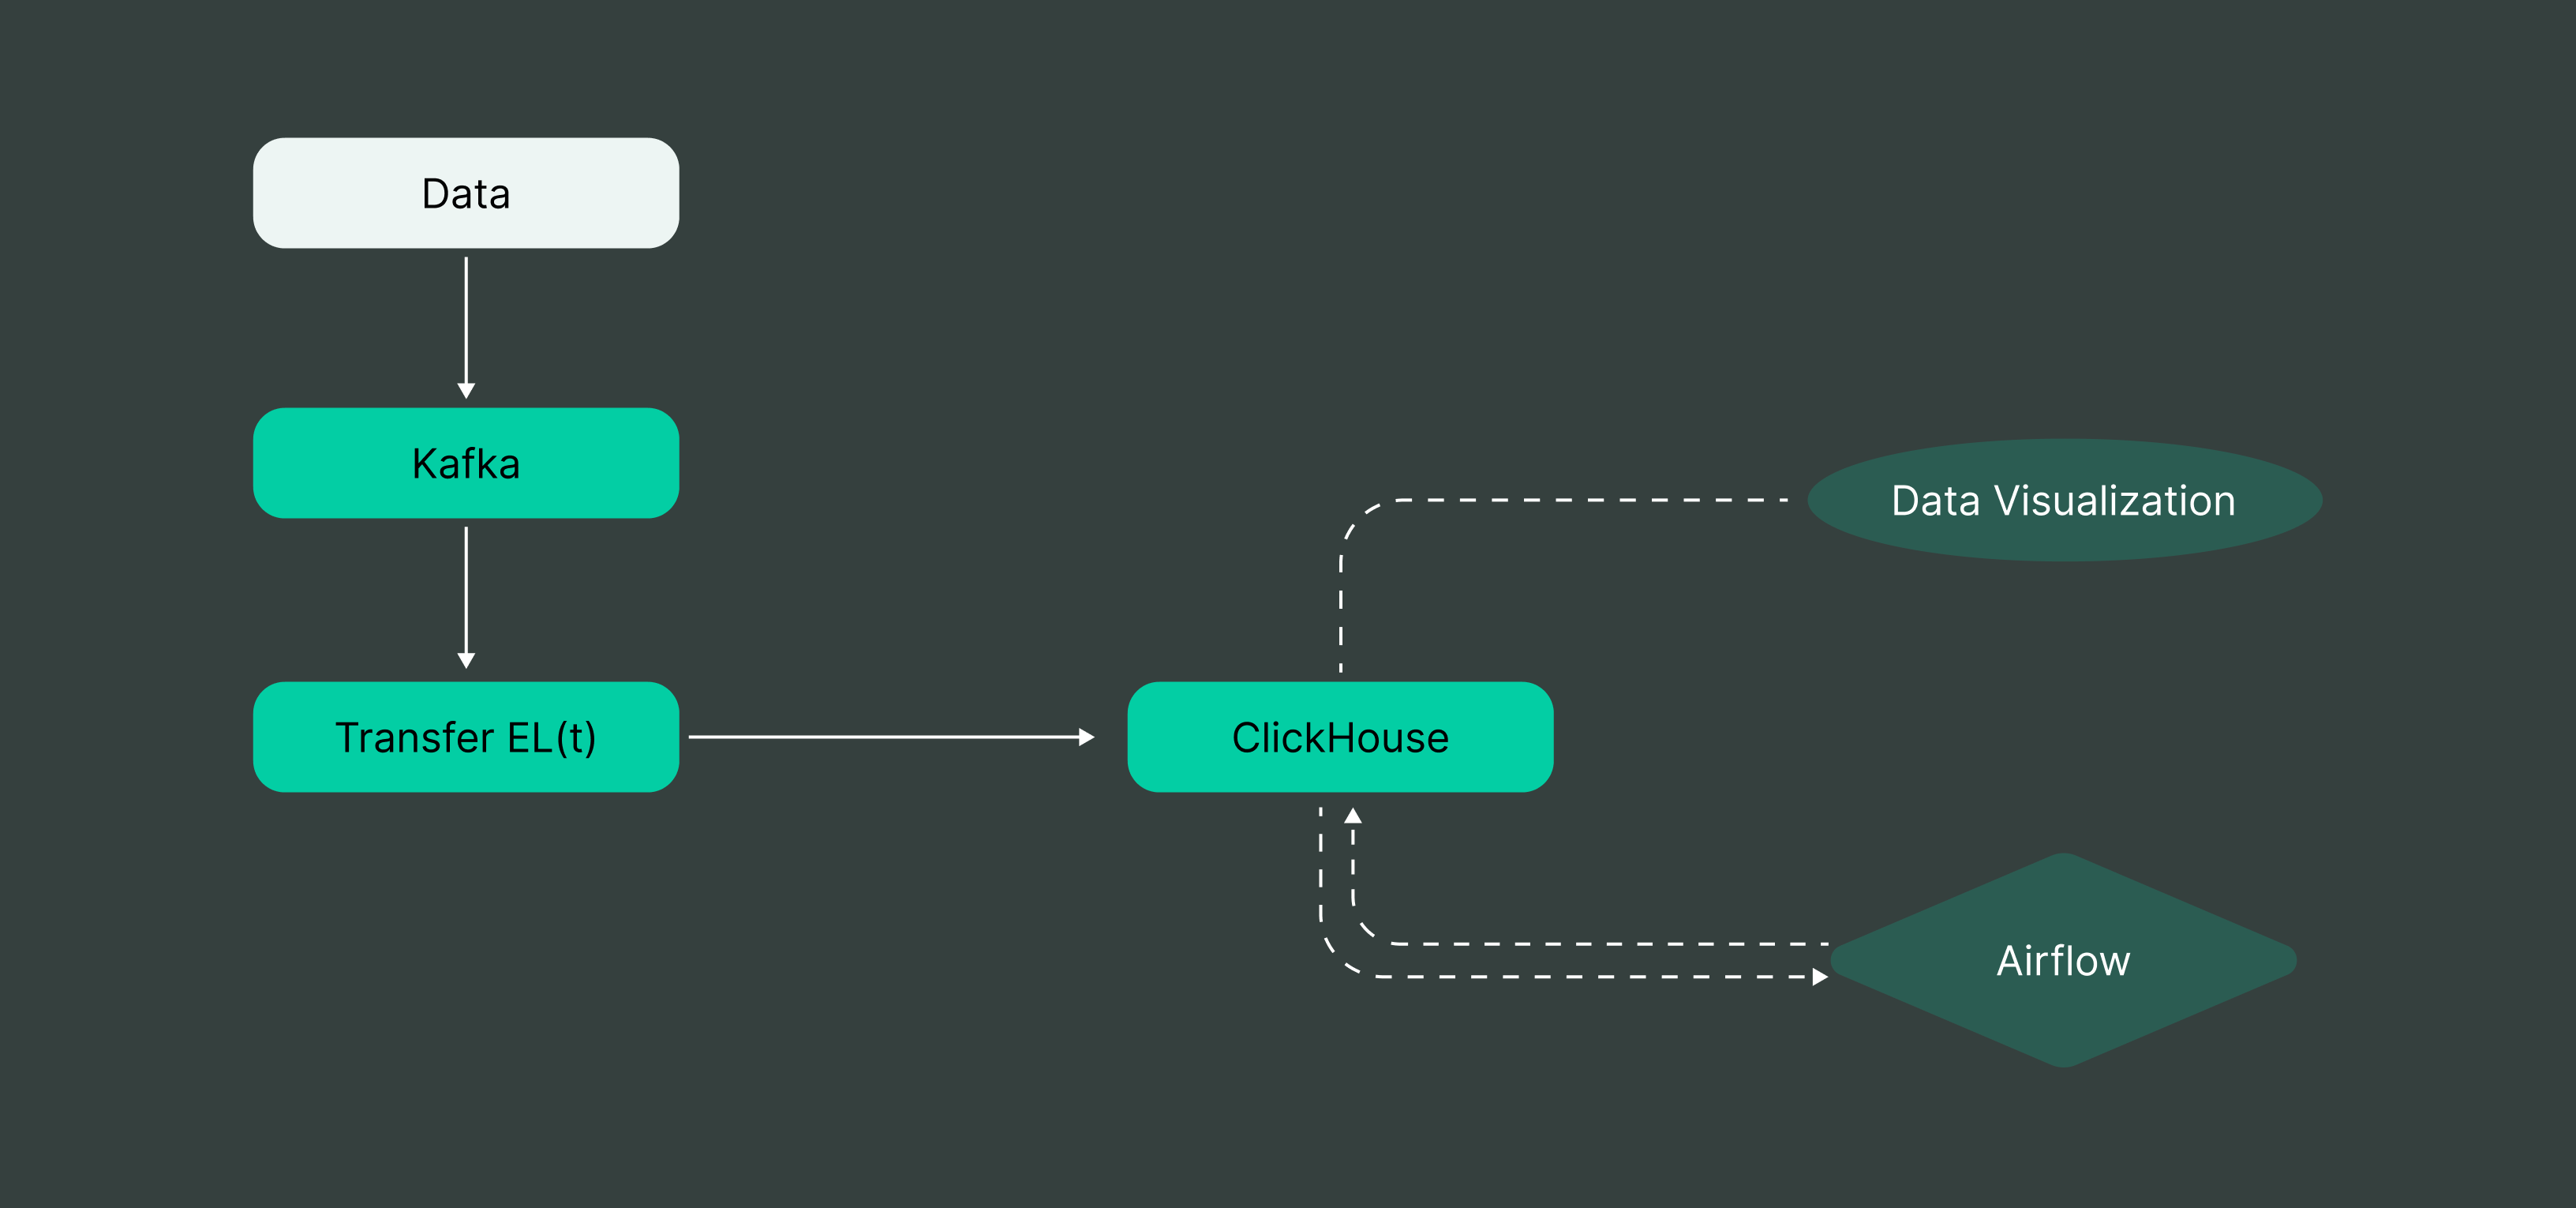
In the diagram, the white part represents an external data provider (such as a web performance monitoring tool), while everything else consists of DoubleCloud managed services. We will use a simple Python script to send data. This first part focuses on data ingestion, the initial setup of our Kafka server, and the data loading process for ClickHouse:
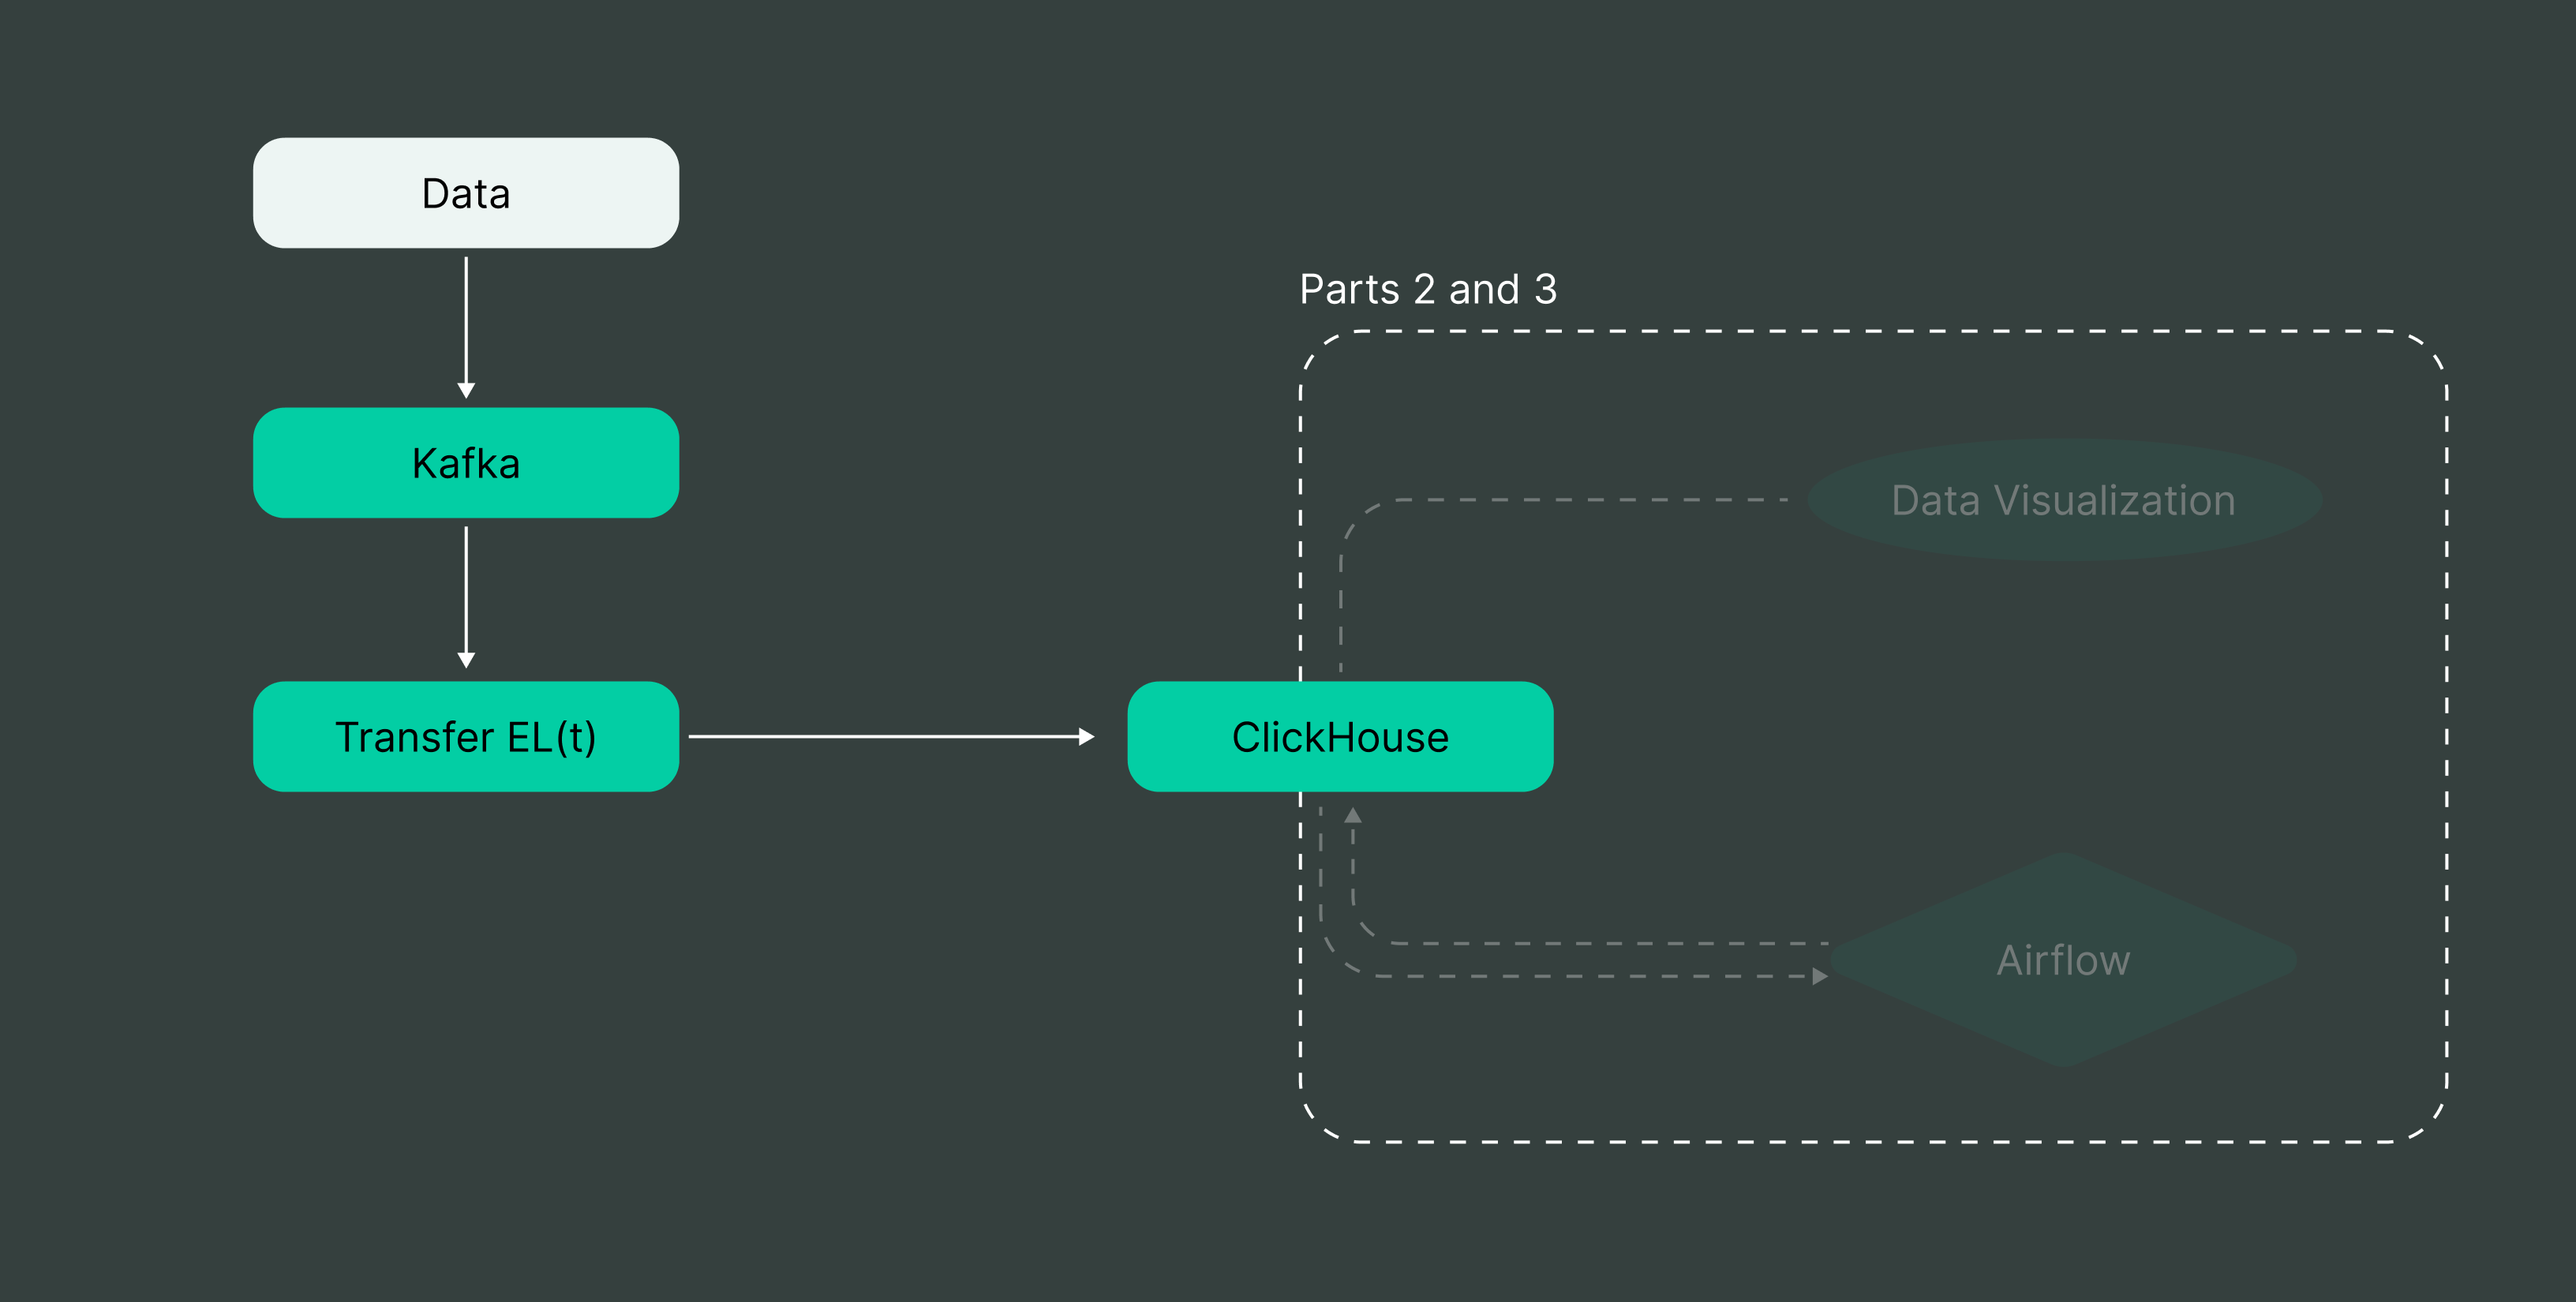
The upcoming parts of the series will focus on aggregations and visualization. While we will address performance when relevant, the primary goal of the series is to describe connecting the various components together.
Problem outline
One of the common tasks in real-time analytics is performing aggregations. We have clickstream data and want to visualize some basic metrics related to user activity on the website. In this example, which will be used throughout the entire series, we will use a subset of fields from our clickstream data to calculate how many products were purchased during specific hours of the day.
Sample event
Here’s an example event from our data source, representing user interactions with products in a marketplace. This event is already enriched with additional information about the user and the item they interacted with:
{
"basket_price": "",
"detectedCorruption": false,
"detectedDuplicate": false,
"eventType": "itemViewEvent",
"firstInSession": true,
"item_id": "bx_VHZvTOyk_CYNTZGlxyopNGYodgtybLKqToopjOqbT",
"item_price": 4876,
"item_url": "https://mu3bxs.webshop24.eu/katalog/item/t-shirt-female-temptation/",
"location": "https://mu3bxs.webshop24.eu/",
"pageViewId": "0:qawVTkAI:IyqIWWkimHqgvBGCbeMMIoosmXiuLcvW",
"partyId": "0:ckQoIhoa:PtdjtCnxGtRzfXvovHcDtltPSaDzpvxM",
"referer": "https://mu3bxs.webshop24.eu//katalog/item/slippers-pink-paradise/",
"remoteHost": "test0",
"sessionId": "0:ZSMAmydy:yqxDDTWQfbRtrauPYAAIGQsCVubHrdov",
"timestamp": 1545127200000,
"userAgentName": "Mozilla/5.0 (Windows NT 5.1) AppleWebKit/537.36 (KHTML, like Gecko) Chrome/27.0.1453.93 Safari/537.36"
}
For the purpose of our example pipeline, we will concentrate on a subset of the event’s fields and set our ingestion pipeline to use only the ones we’re interested in. To compute aggregated statistics, we will need the following fields:
-
partyId(string key, denoting global userId) -
sessionId(string key, used to mark the same user session) -
item_price(integer representing the price of an item) -
eventType(string field for the type of event) -
detectedDuplicateanddetectedCorruption(boolean fields from upcoming data enrichment systems that will be used to filter data)
Everything else is unnecessary for our example use case, but it’s helpful to know what those fields are in case there is a need for further analysis later.
The Python code, along with sample data and instructions on how to run it, can be found in this repository.
Setup infrastructure
Kafka cluster
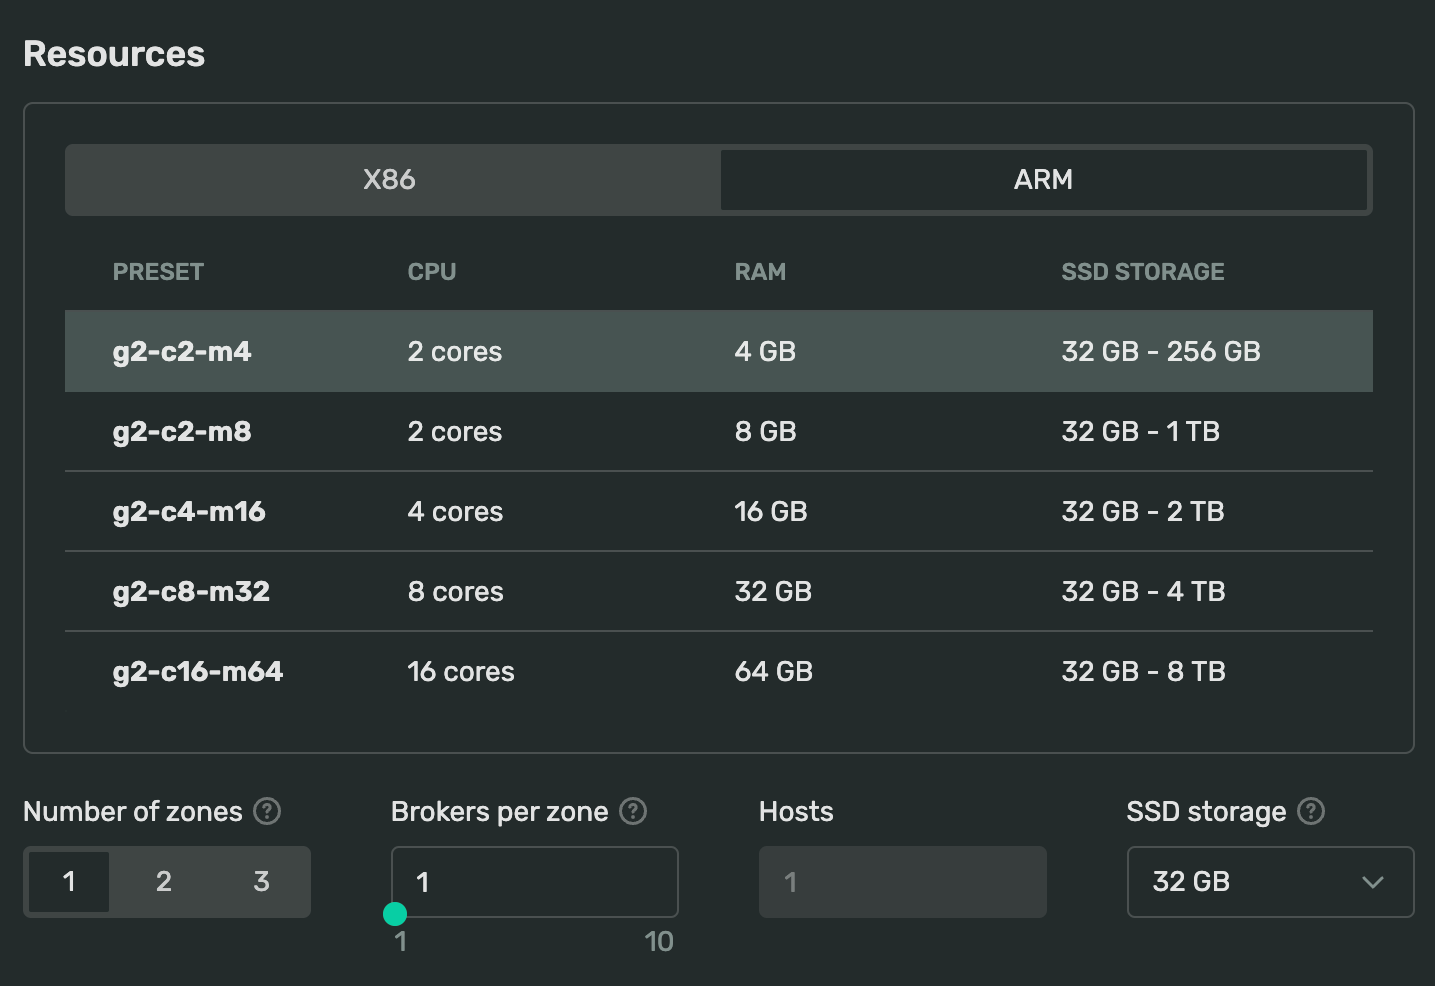
We will use Kafka as our ingestion layer. For the purposes of this series, we can go with the default options: select the eu-central-1 zone and choose the smallest possible configuration. The only change I would personally recommend is opting for an ARM architecture, as it tends to perform slightly better, as highlighted in our article on this topic: Benchmarking Apache Kafka: performance per price.
Simply pick a cluster name you’re comfortable with, select a recent Kafka version (3.5), and you’re all set!

Managed Service for Apache Kafka
Fully managed, secure, and highly available service for distributed delivery, storage, and real-time data processing.
Provisioning should take a few minutes (we can create the ClickHouse cluster in the meantime). Once the cluster is up and running, let’s navigate to cluster settings and create a topic for our events.
Kafka topic for incoming messages
We will be using a standard architectural pattern of having a single topic per schema, meaning that each different schema of messages will be assigned to a separate topic. Therefore, we need to create a topic for incoming messages, which can be done through the same cluster control interface.

For the purpose of this tutorial, our load is non-threatening, so we can use a simple topic with just one partition and a replication factor of one.
AllowList caveat
To simplify testing, DoubleCloud adds your IP address to the ALLOW LIST in the cluster settings. Keep this in mind if you frequently switch Wi-Fi networks while working from your laptop.
ClickHouse cluster
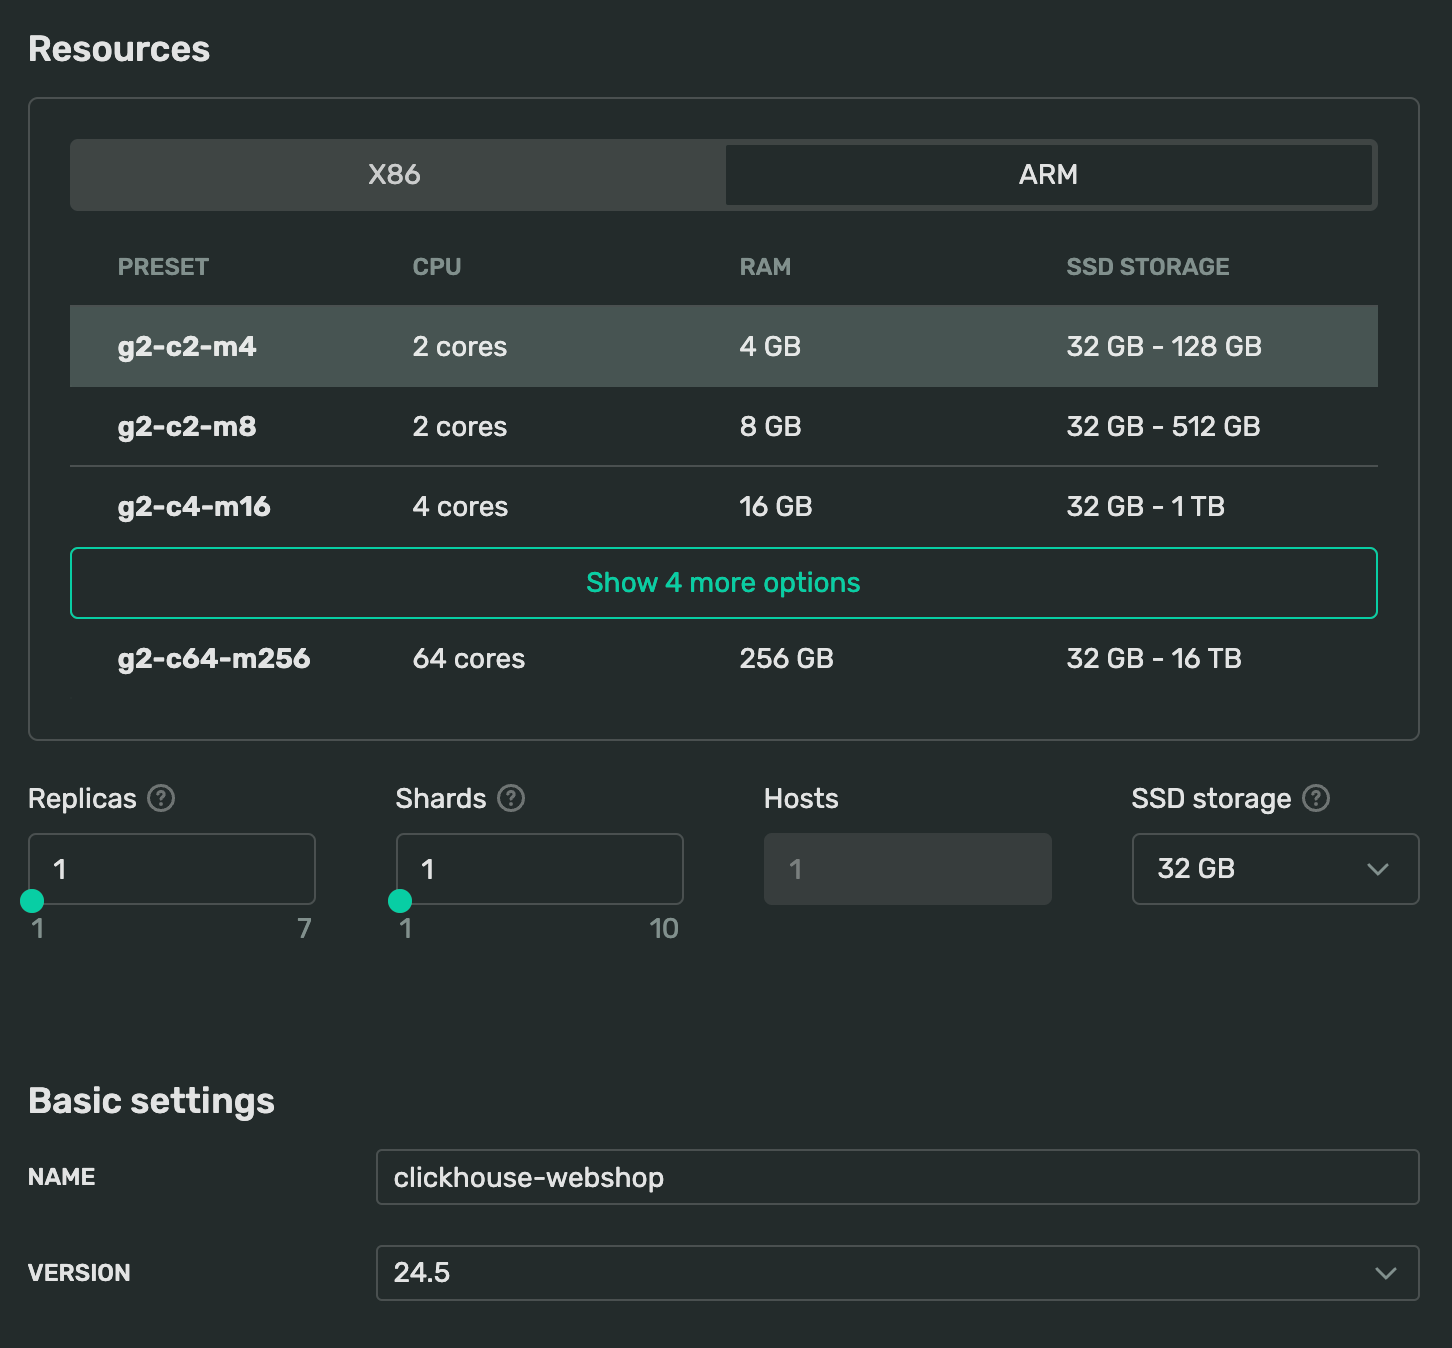
For the ClickHouse cluster, let’s select the same availability zone and opt for the smallest possible setup: 1 replica and 1 shard, resulting in a single ARM node with just 32 GB of storage. While you would typically want a more robust configuration for production, these defaults are sufficient for our current needs. We’ll discuss scaling a bit in future parts of this series.

Managed Service for ClickHouse
Fully managed service from the creators of the world’s 1st managed ClickHouse. Backups, 24/7 monitoring, auto-scaling, and updates.
Choose a reasonable name for the cluster and select a relevant version. The cluster creation UI defaults to the latest LTS version, but there’s nothing stopping us from opting for a more recent one.
ClickHouse database
While we can use the default database for ClickHouse, it makes sense to create a different one for our application. Let’s go ahead and do that. There are multiple ways to access our cluster, but the easiest method is to use the WebSQL interface. From the cluster interface, click on the WebSQL button to open the interface in the new tab.
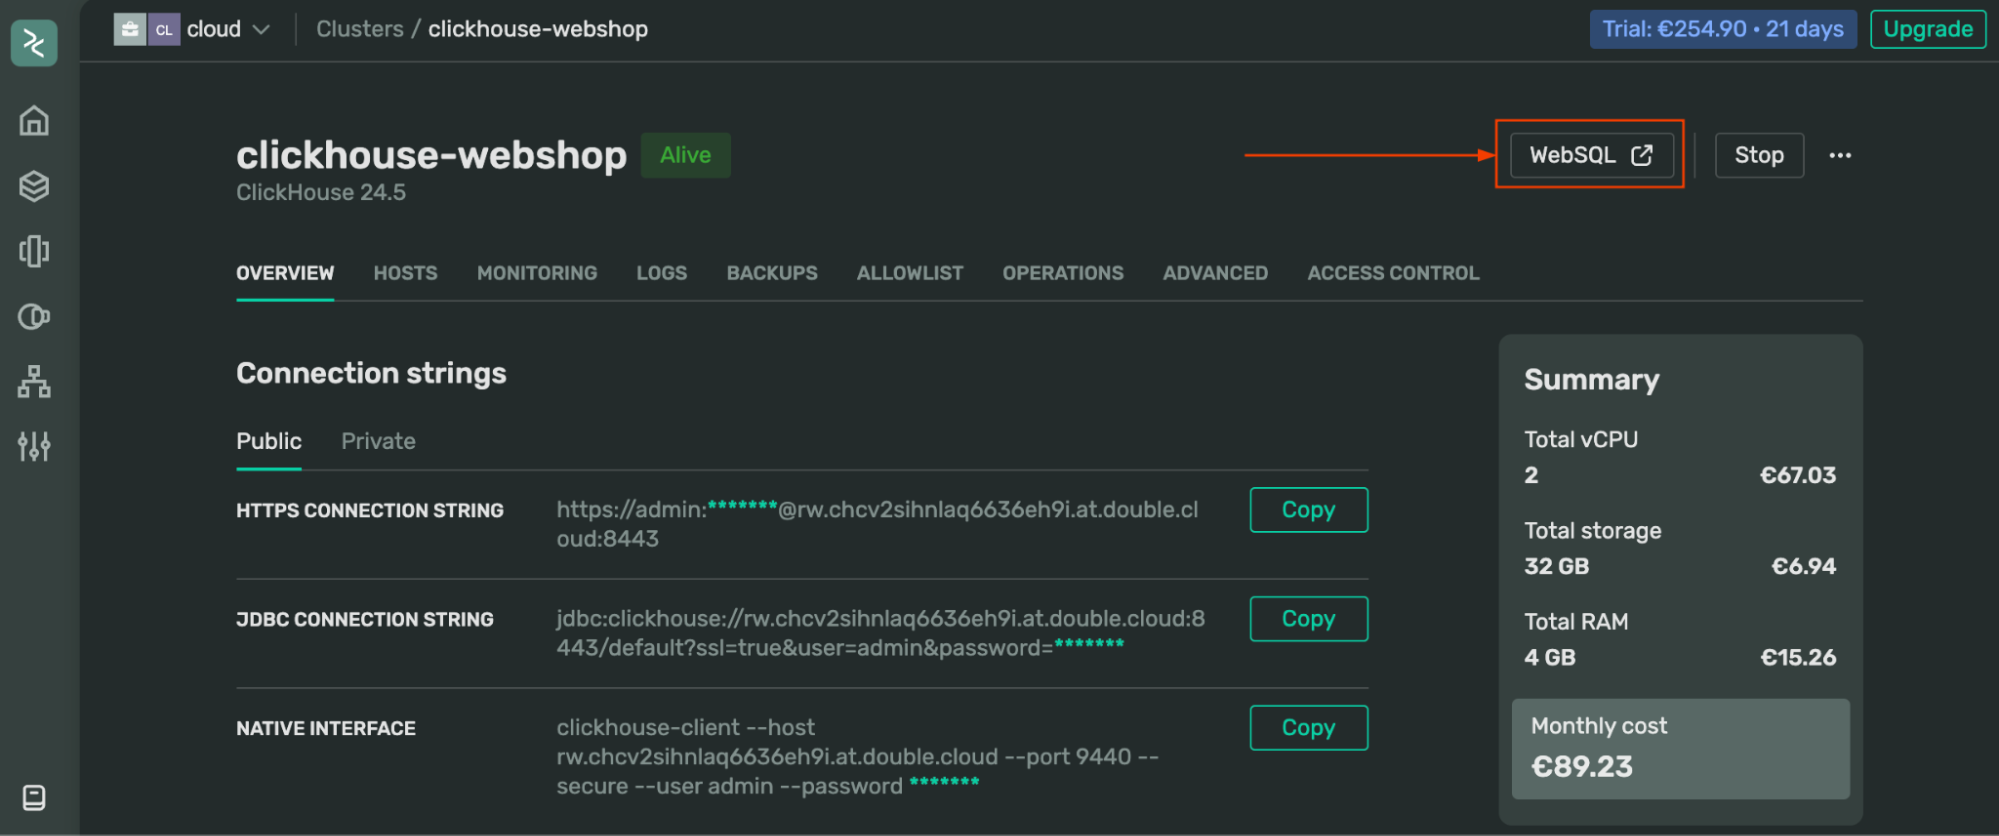
This will automatically connect to the cluster and authorize with admin credentials. Clicking on any entity in the left tree menu will open the query editor. Execute the following code to create a new database:
CREATE DATABASE webshop;
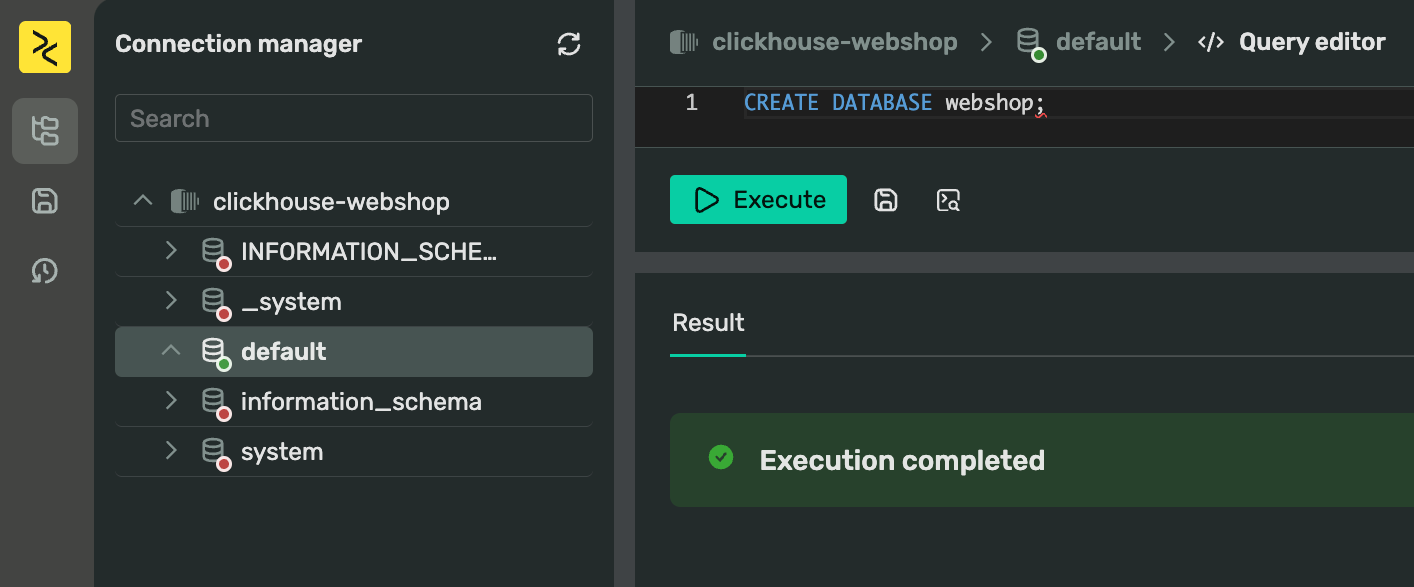
I suggest naming the new database webshop, and I will use this name in the examples moving forward. Now that we have our source and destination set up, let’s create a Data Transfer pipeline to connect them.
AllowList caveat
Similar to the Kafka cluster, DoubleCloud adds your IP address to the ALLOW LIST in the cluster settings behind the scenes. Keep this in mind if you frequently switch Wi-Fi networks while working from your laptop. It is advised not to open your cluster to the world carelessly, even for short-term testing purposes.
Setup transfer endpoints
DoubleCloud provides a convenient way to ingest data from Kafka to ClickHouse through a tool called Data Transfer. We will use Transfer to read data from our Kafka topic (referred to as the source endpoint in Transfer’s terminology) and publish it to ClickHouse (the target endpoint in Transfer’s terminology). Let’s set it up!
Kafka: Transport source endpoint
Navigate to the Transfer page, switch to the Endpoint tab, and create a source endpoint. Select Kafka as the source type in the dropdown and give it a reasonable name (this name will be used internally by Transfer).
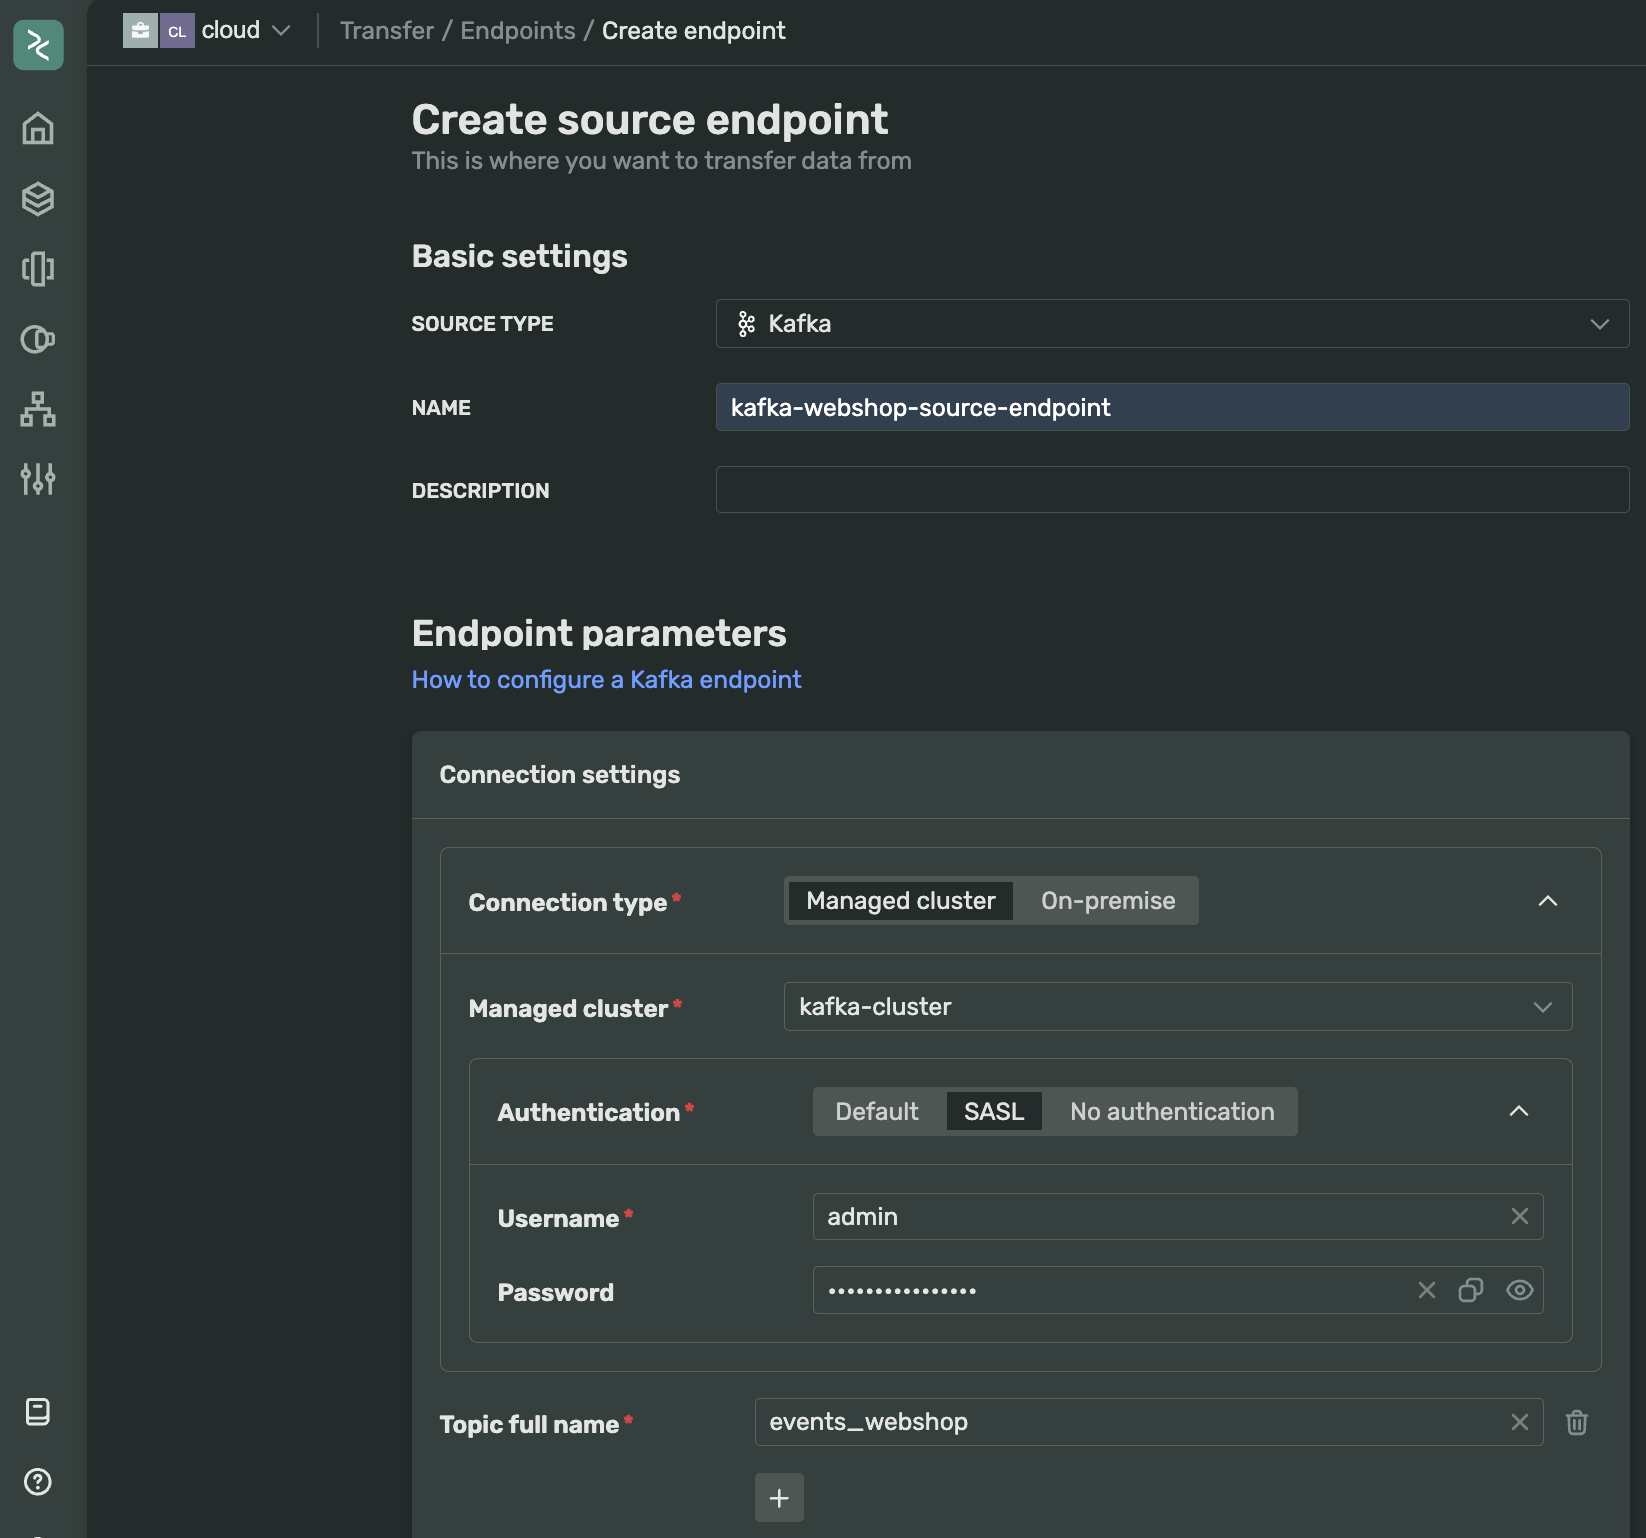
Select the recently created Kafka cluster and use the credentials to connect to it via SASL. To make the endpoint functional, add the topic that was created earlier.
JSON fields
Since the initial analysis of event data showed that we don’t need all the fields, we can include only the ones we are interested in. This can be done using the Advanced settings tab, where we can specify a JSON conversion rule with a list of relevant fields. Here’s what I ended up with:
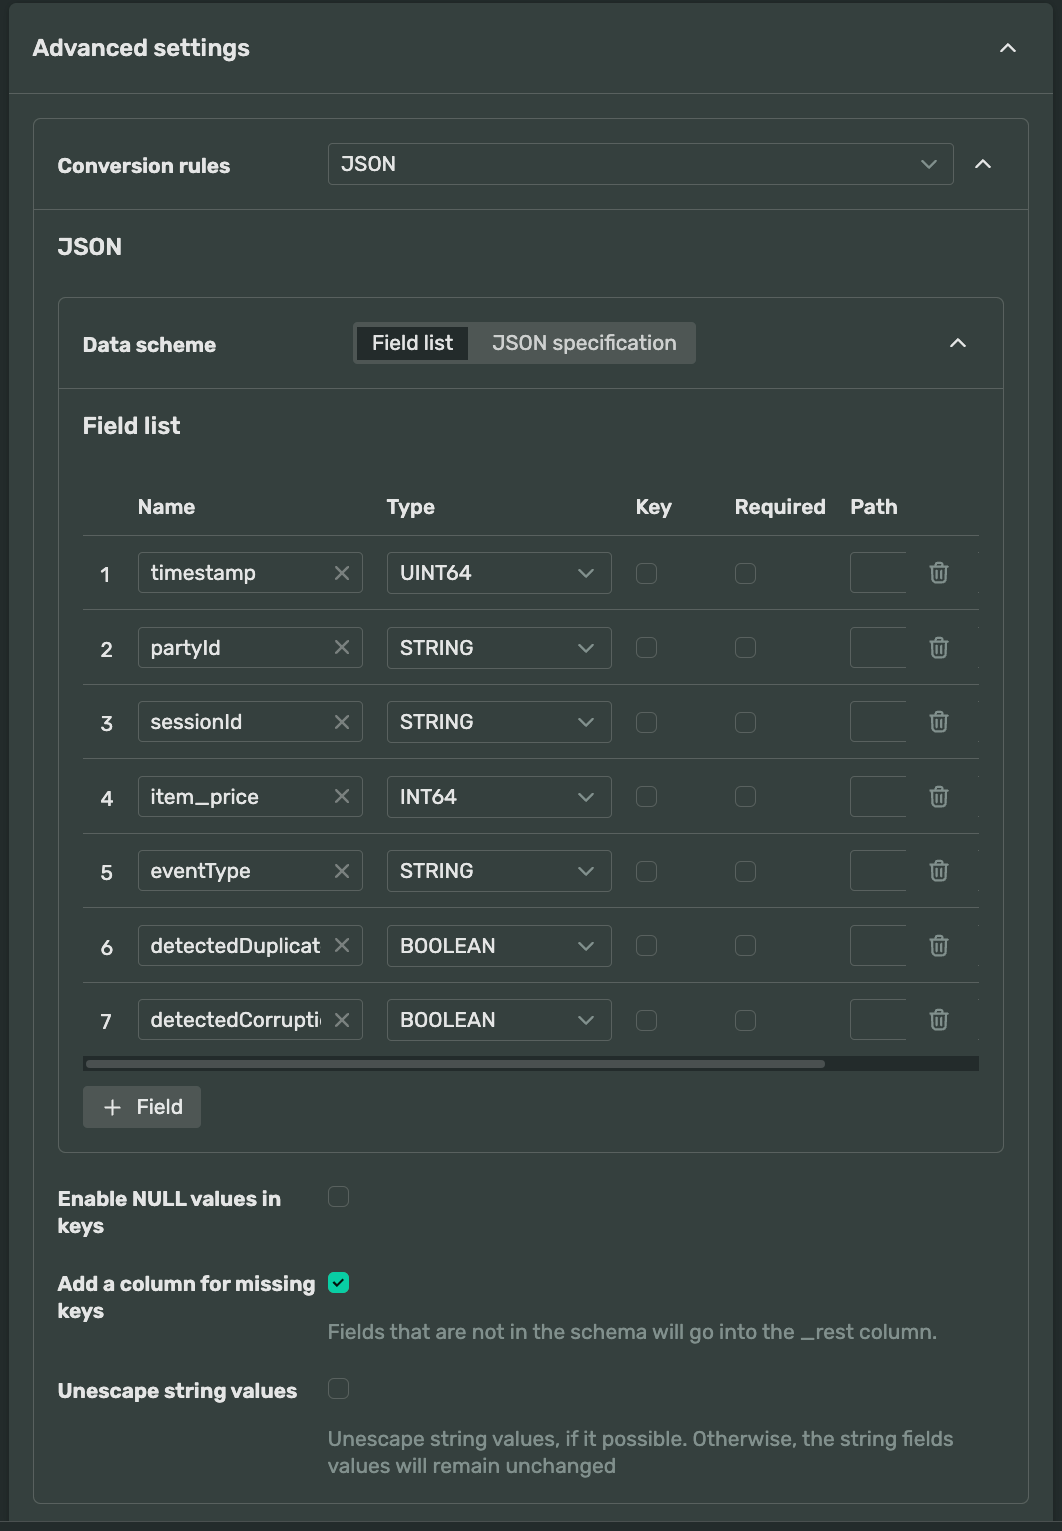
Additionally, since I might be interested in other fields later, I’ll make sure that a corresponding option is enabled, just in case.
ClickHouse: Transport target endpoint
Creating the target endpoint is straightforward as well. There’s no need for any additional setup; simply select the connection type, choose the correct cluster from the dropdown menu, and specify the target database (schema).
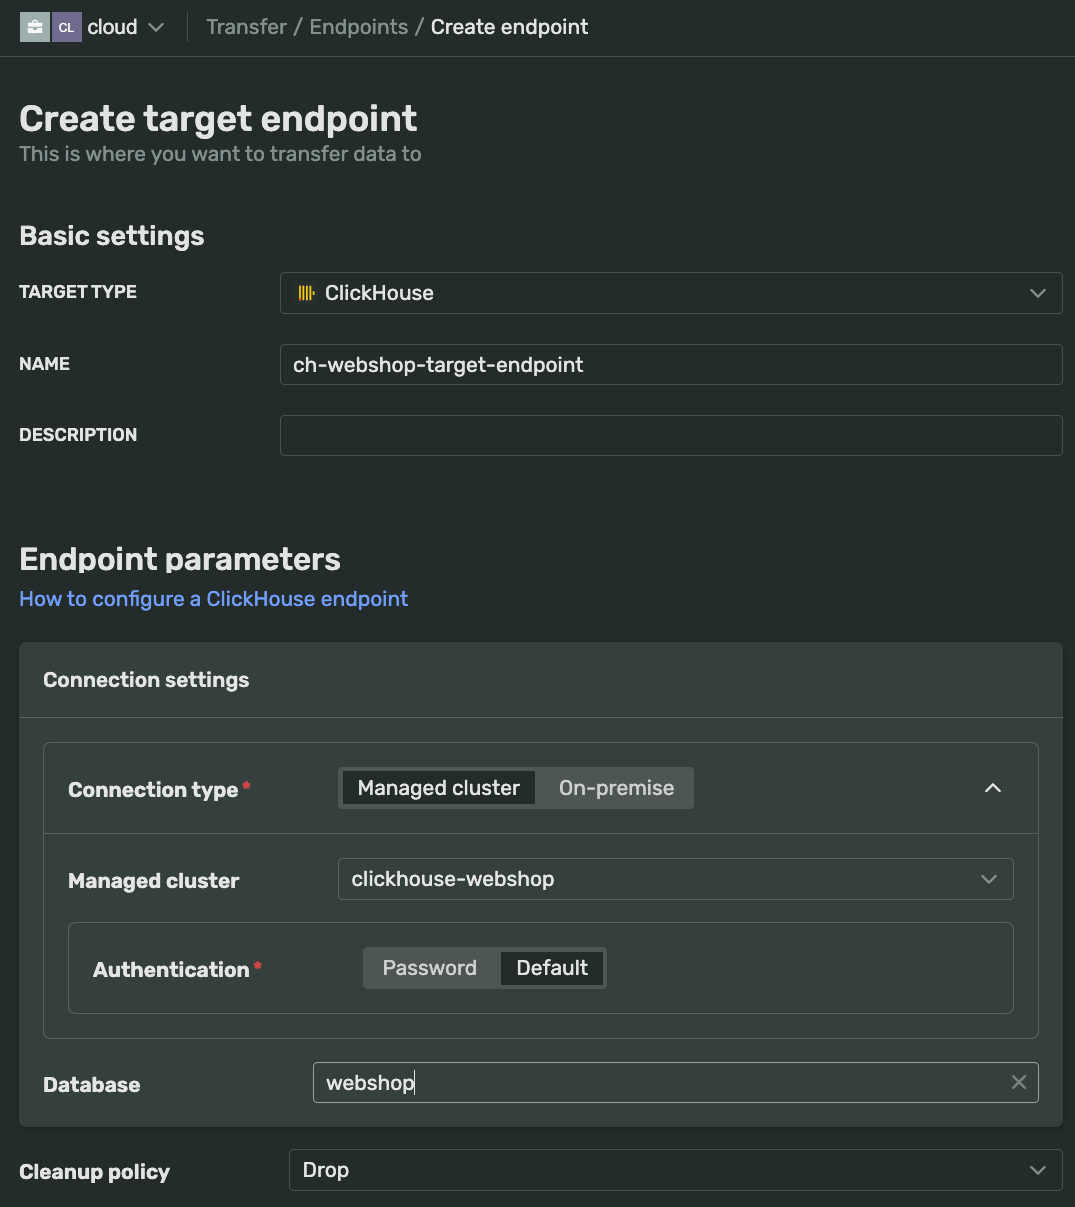
Now that both endpoints are set up, we need to create the transfer itself.
Creating and activating the Transfer
We need to specify the created endpoints, choose a name, and that’s it. Everything else can be left at the default settings. Click “Submit” and grab a cup of tea while the transfer is being created.
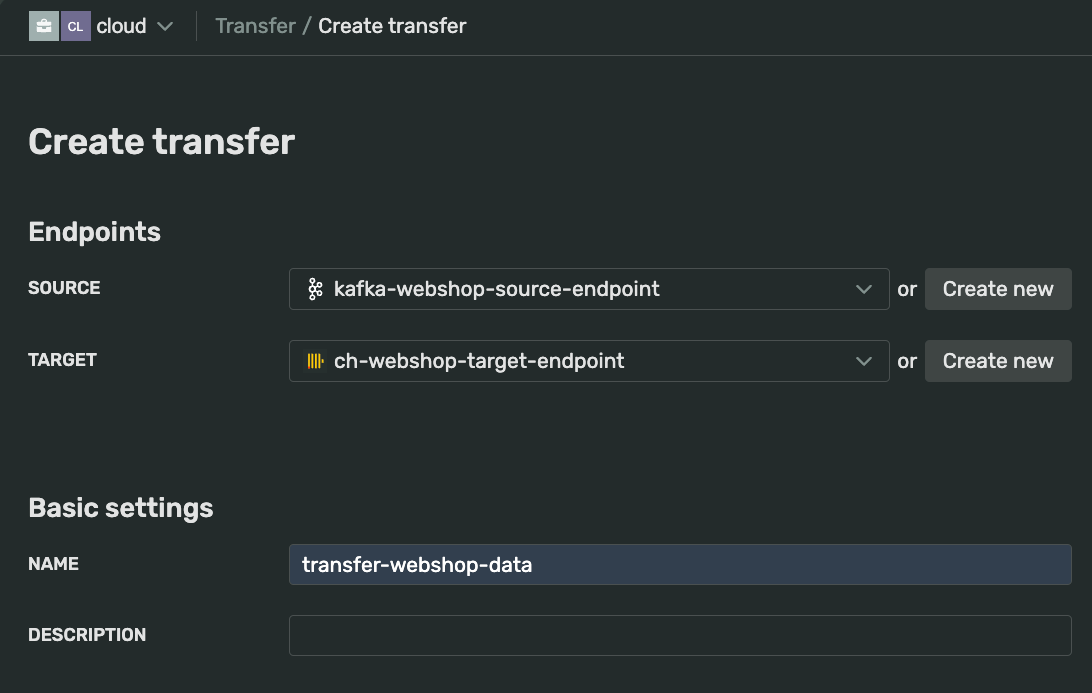
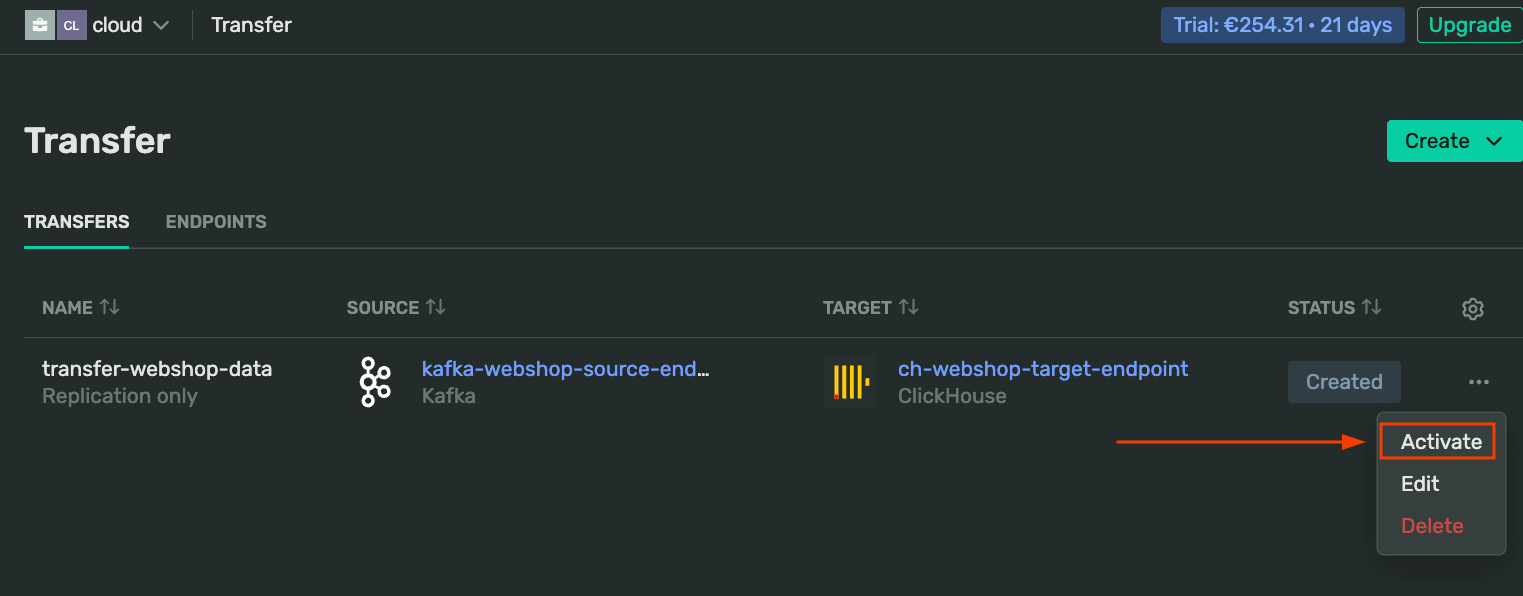
Once the transfer is created, we need to activate it and ensure it is running (its status should change accordingly).
Producer script
To test the pipeline, we will be producing 1,000 events from a file using a Python script. You can check the source here.
To run the script, install the required packages, set the environment variables for cluster access, and execute the following command in the terminal:
clickstream/produce_events.py
This will produce 1,000 events from the file events1000.jsonl. Refer to the README if you want to customize something, encounter any issues or if you want to manipulate the data first, such as moving it in time if needed.
Sanity checks to ensure everything works as expected
Let’s perform some queries from the WebSQL interface to check our data. If we open WebSQL Query editor, we can see that all 1,000 events have arrived:
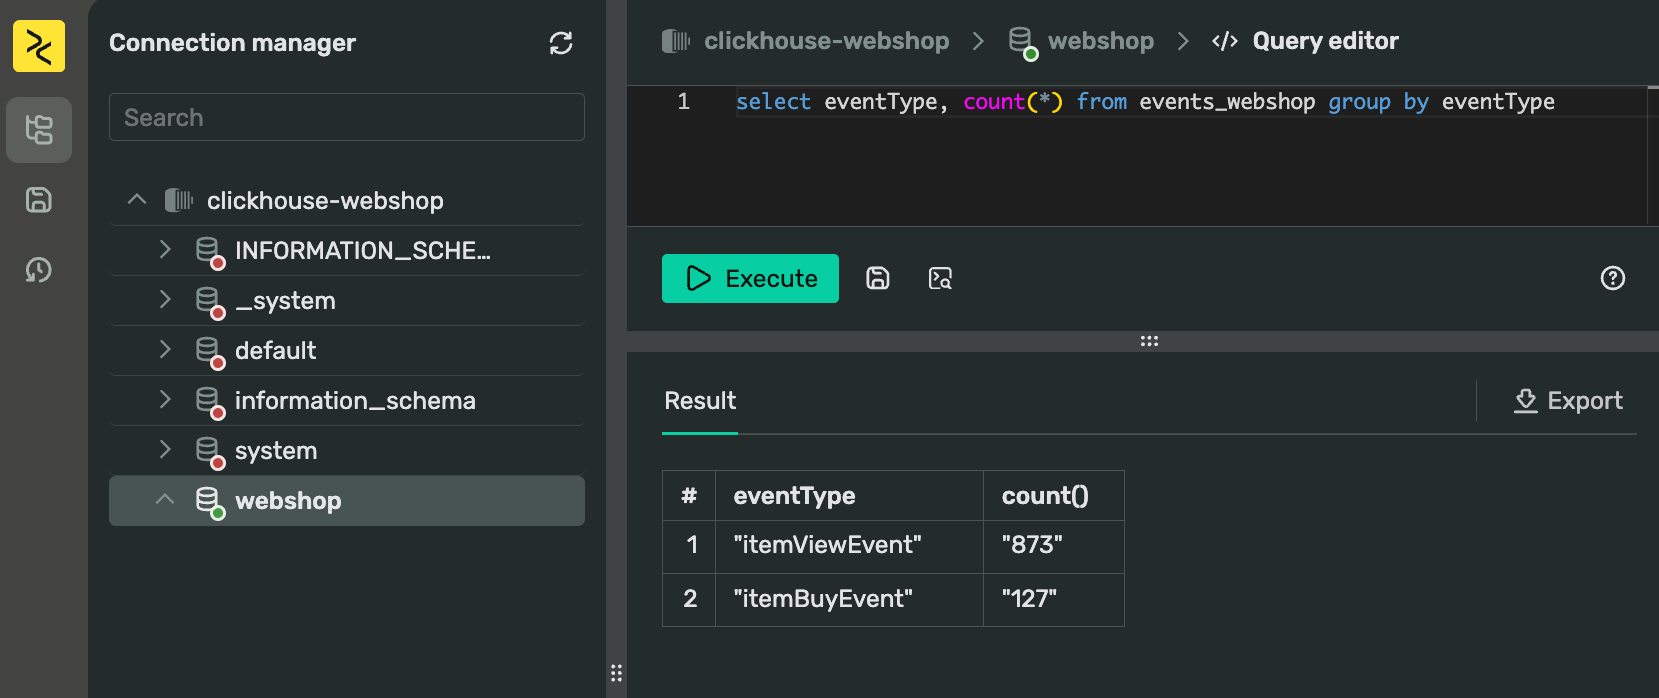
The next logical step is to verify that the timestamps are in the expected format:
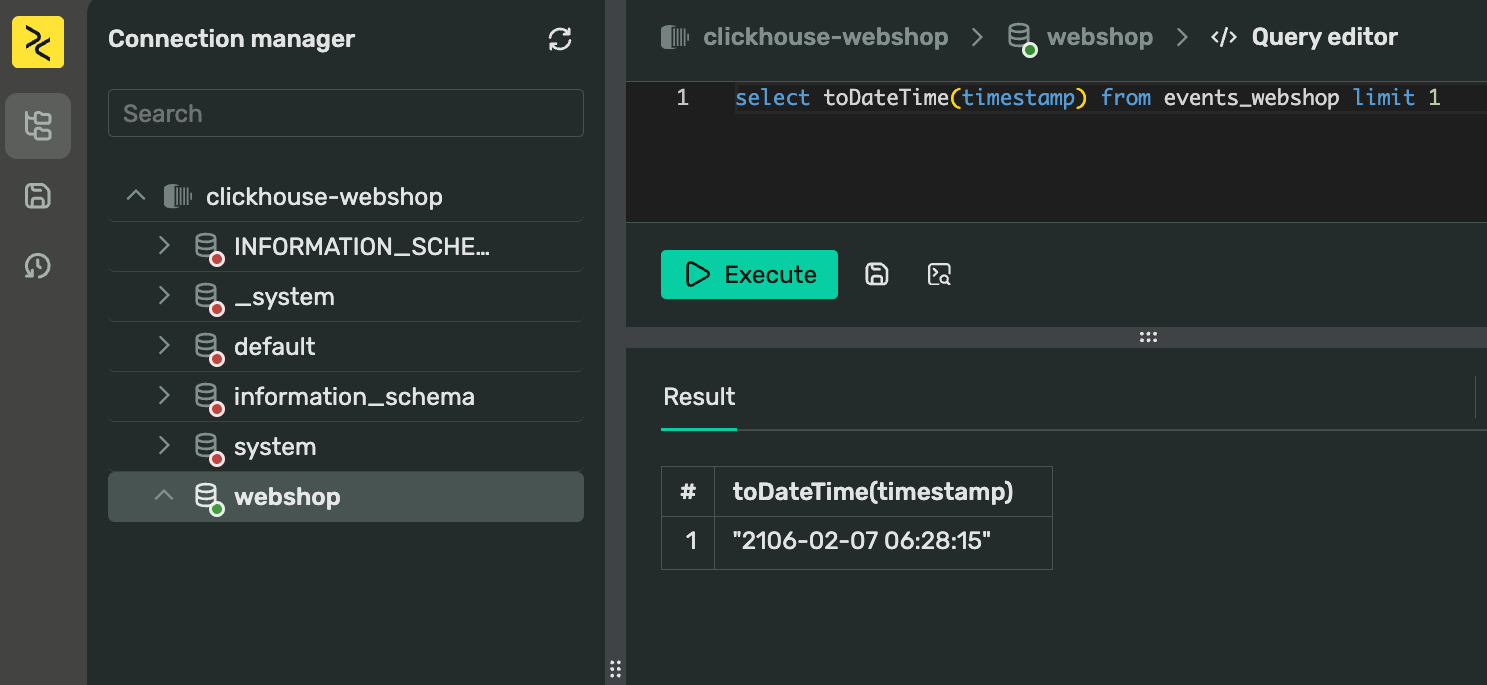
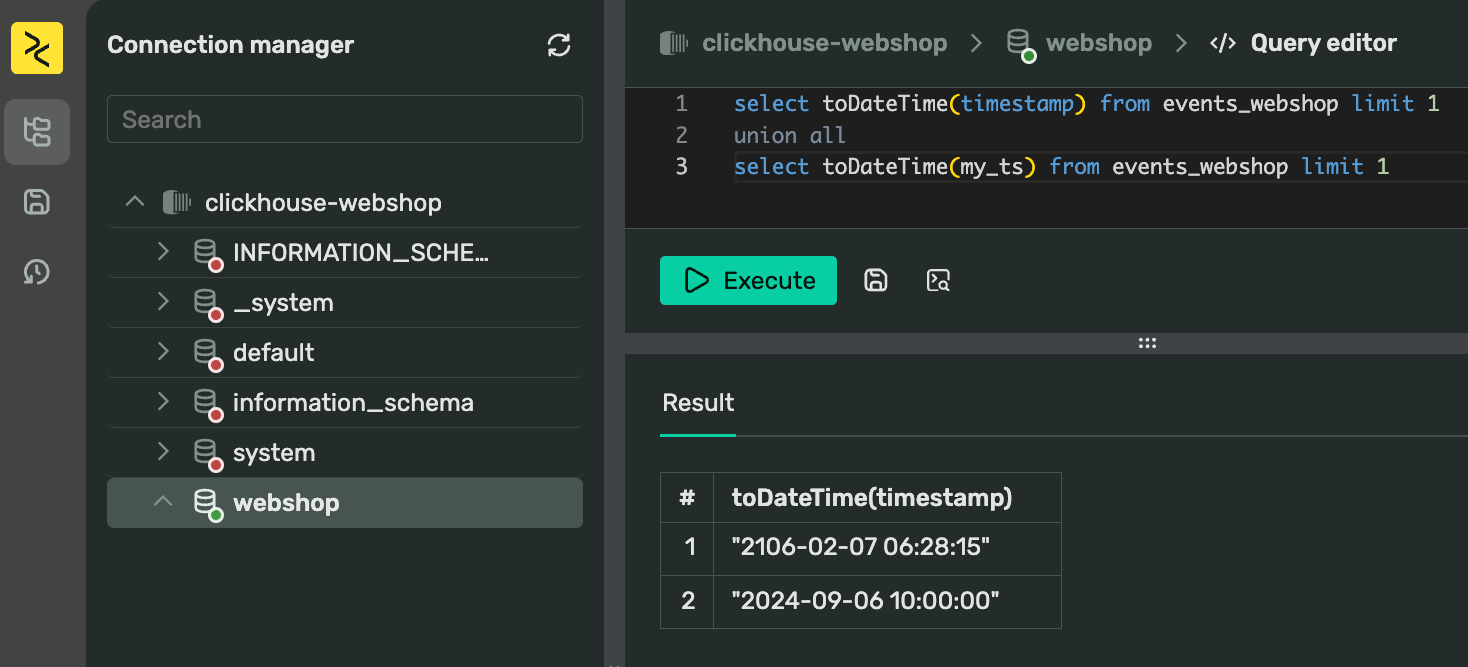
It appears that the dates are slightly too futuristic. A common issue with numeric timestamps from different systems is that they might use different time formats. For example, one system might use microseconds while another uses seconds. Let’s see if dividing the timestamp resolves the issue:
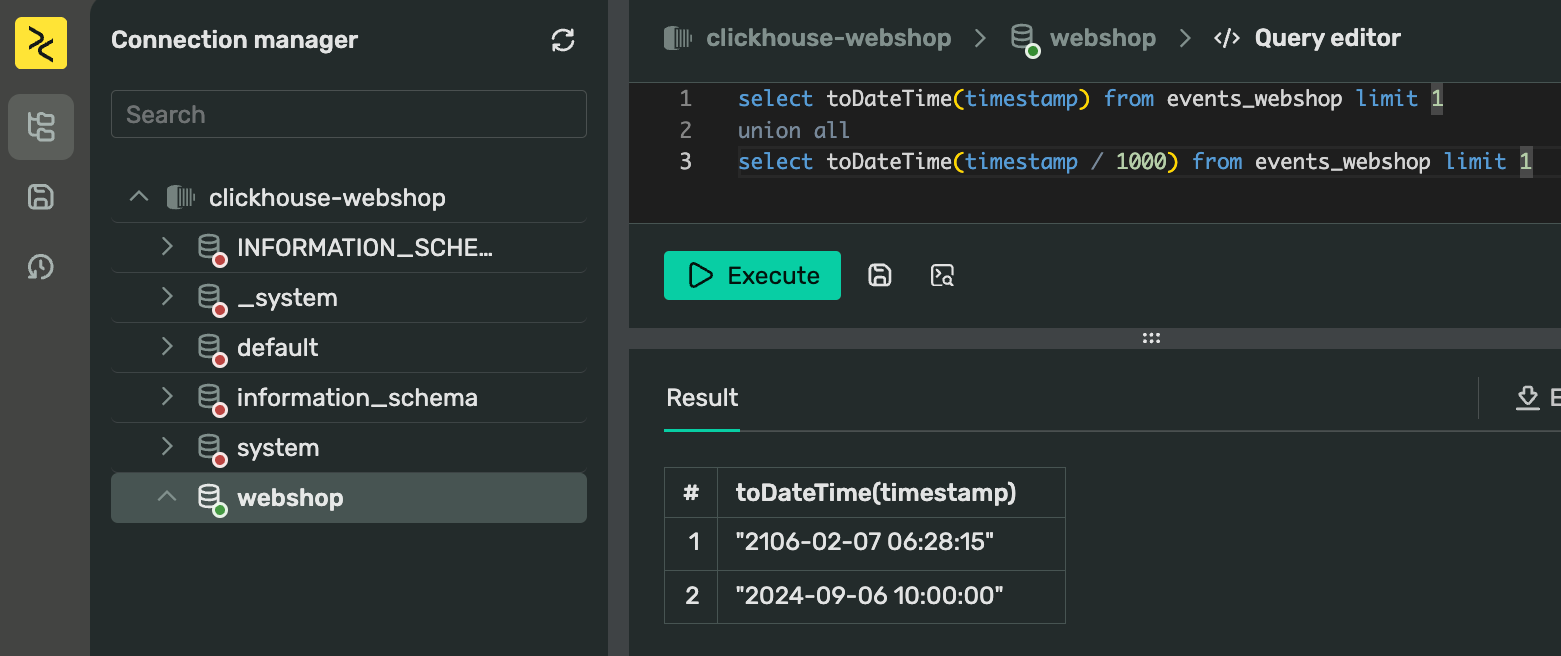
And indeed, it does! We now have two options:
- Account for the fact that our timestamps need special treatment before proceeding with the analysis.
- Transform the timestamps upon ingestion.
Typical data modeling approach is to choose the first option, where you don’t modify data at the ingestion “source” level and instead perform preparation in the next stage.
However, in modern data pipelines, it is generally acceptable to perform simple transformations during ingestion, as long as they are indeed straightforward. Thankfully, Transfer is capable of doing just that!
Adding transformation
If we go back to our transfer and open Edit view, we’ll find a button labeled “Transformation” towards the end of the page:
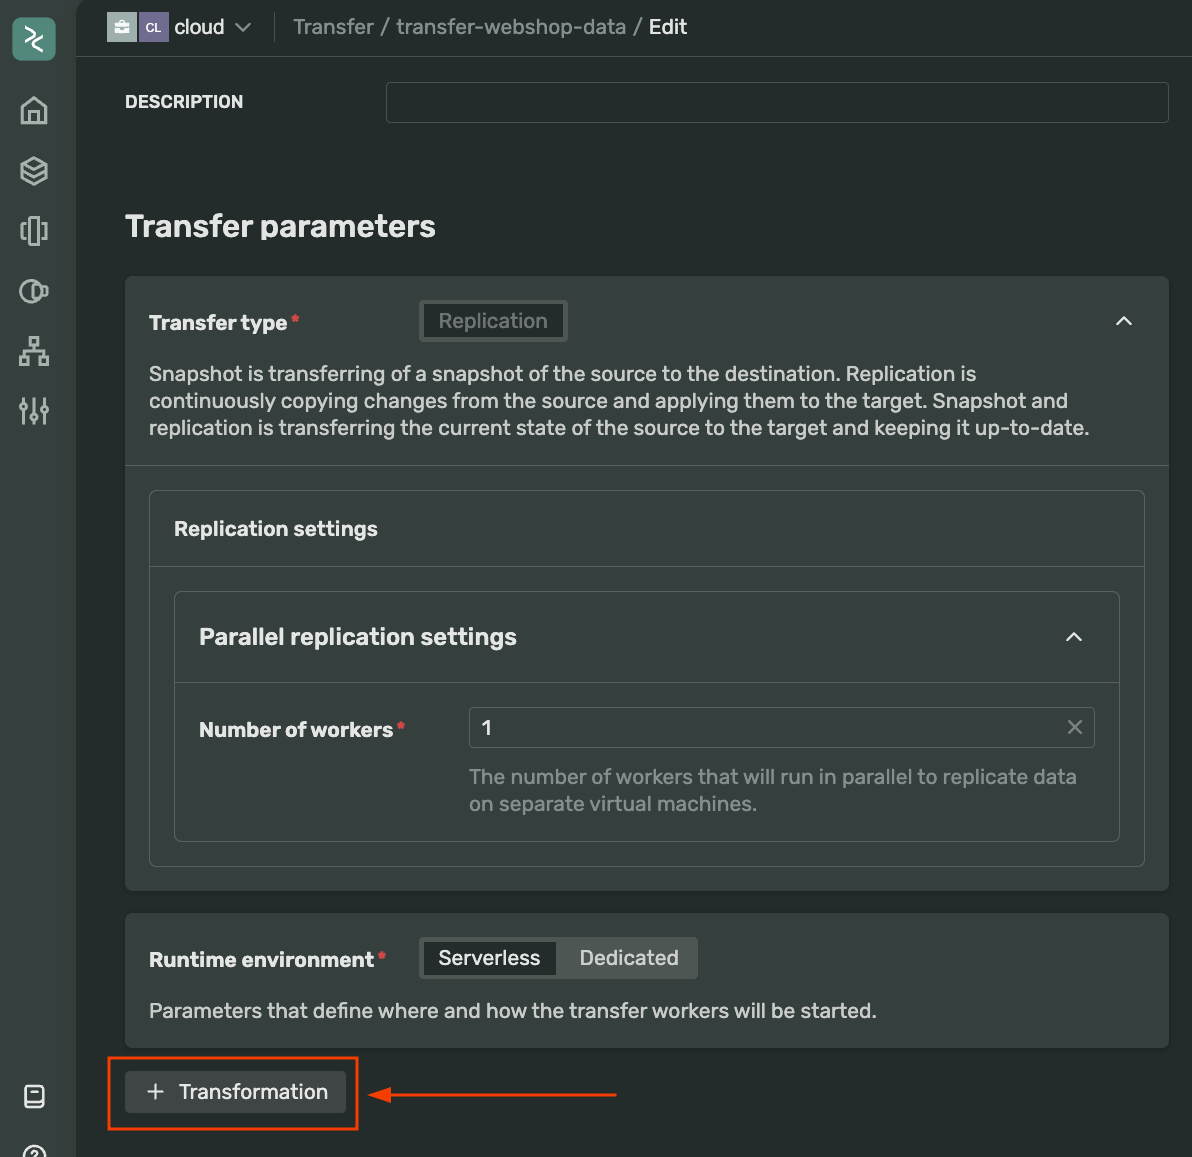
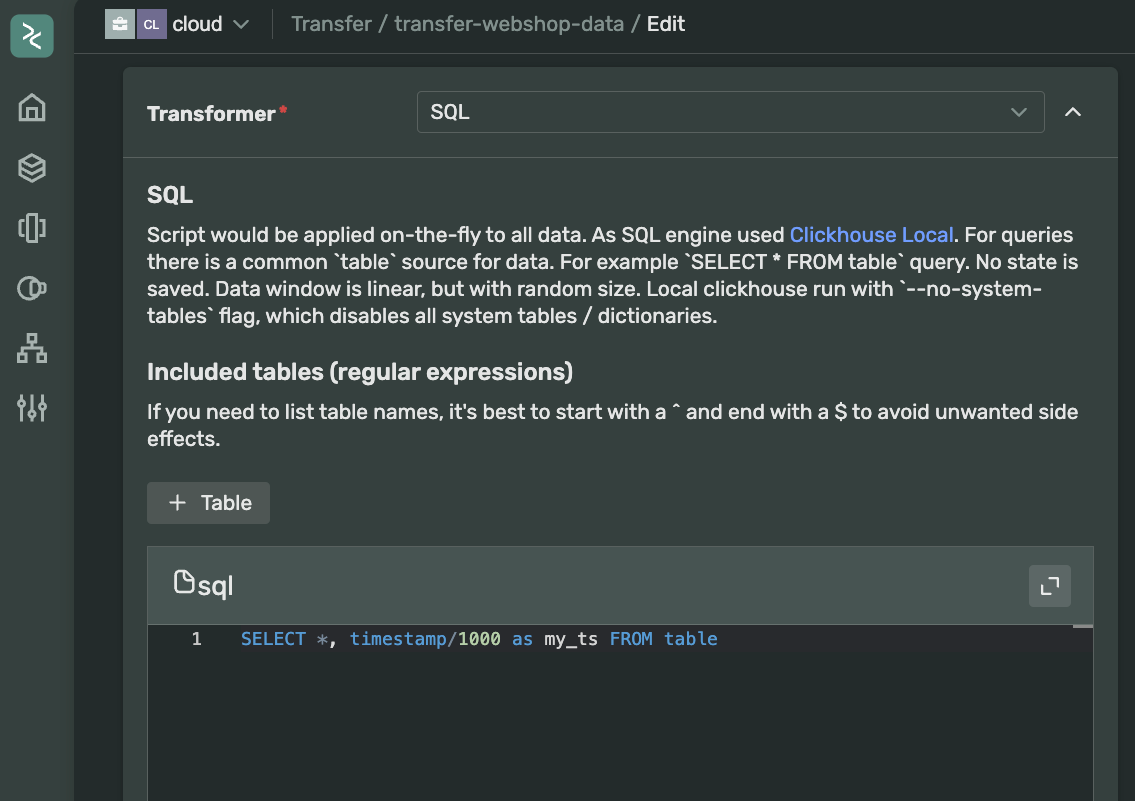
This humble little feature is exactly what we need for our transformation. Transfer supports multiple ways to adjust your data as it moves between endpoints. We will use the on-the-fly SQL processor. Click on the button and select “SQL” from the Transformer dropdown. I’ll create a new field called “my_ts” that will hold the original timestamp divided by 1,000:
By the way, Transfer allows you to stack multiple transformations in a chain of operations if you wish. However, there are some limitations to what is possible and, more importantly, what should be done at this step. Keep in mind that these operations are effectively hidden from your view, so you should avoid extensive data transformations here and instead leave that to your ETL processes in the next stage of the data processing pipeline.
Check the final result
Update the transfer, drop the table (since we are altering the scheme, this is the easiest way to update it), produce new data, and voilà! We have our timestamp in expected format and within the correct century.
Wrap up
In just a few clicks, we have created a Kafka cluster, a ClickHouse cluster, and a Transfer pipeline with on-the-fly data transformation that now ingests incoming data in our database. We have everything ready to start computing aggregates, which we will cover in the next part. Stay tuned for Part II!
If you have any questions or would like to discuss this series further, feel free to reach out on Slack.
Get started with DoubleCloud


