Service overview
DoubleCloud Visualization is a business analytics service. It allows you to visualize data from different sources, build dashboards, and review your data.
Use Visualization to monitor your data metrics directly and make data-driven decisions.
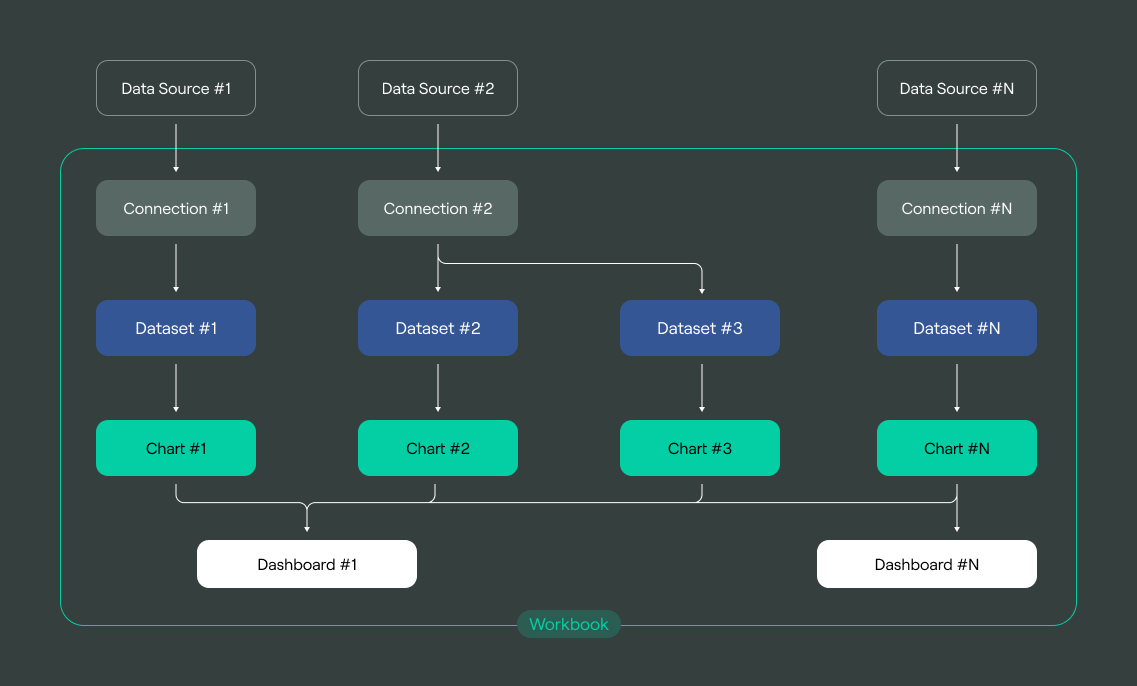
Relationship between entities within the service
Visualization consists of a number of entities which provide you with a comprehensive toolset for representing your data in graphical form.

Visualization consists of the following entities:
-
Collection: A container that stores multiple workbooks created by different users and other collections.
-
Workbook: A container that stores the whole data processing toolkit:
-
Connection: A set of parameters to access a data source.
-
Dataset: A tool that connects to a data source, organizes its data into fields, applies aggregation functions to them, and creates default filters for new charts.
-
Chart: Visualized data from a data source or a dataset (charts, tables, maps ans indicators) and data filtering tools (selectors).
-
Dashboard: A page containing charts and widgets organized into tabs with links between them.
-