Add a hierarchy to a chart
A hierarchy allows you to add additional structure to your data and increase informative contents of a visualization.
Warning
You can't add a hierarchy to the following chart types:
-
All map charts
-
Indicators
-
Tree charts
-
Pivot tables
To add a hierarchy to your chart:
-
In the chart wizard, to the right of the Search field, click + → Hierarchy.
-
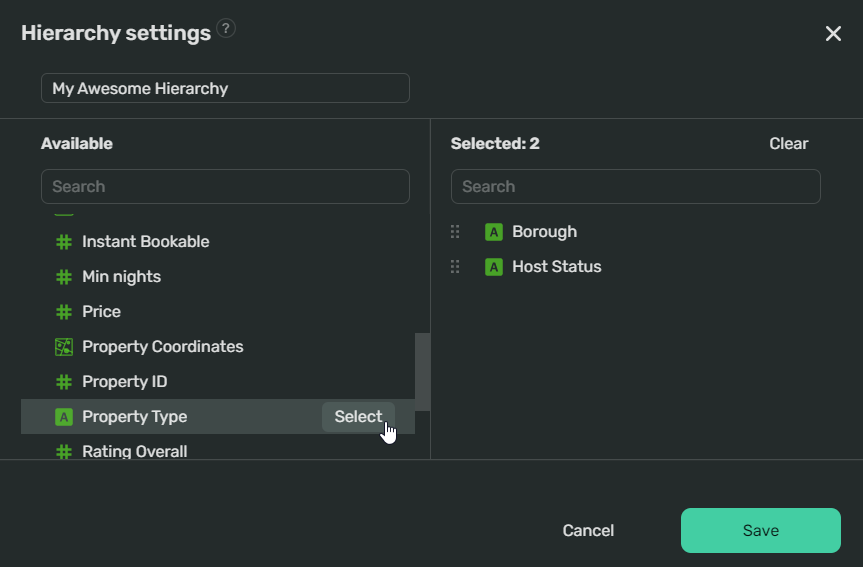
In the Hierarchy settings dialog window:

-
Specify the name of your hierarchy in the text field under the dialog name.
-
You'll see the available data fields on the left. To add them to your hierarchy, hover your cursor over a field and click Select.
You can drag and drop fields in the Selected section to arrange them to your liking.
-
-
Click Save. You'll see your new hierarchy in the data fields list:

-
Drag your hierarchy to the appropriate section of your chart. In the preview section of the wizard, you'll see the hierarchy panel on top of your chart:

-
In the top-right corner of your chart wizard, click Apply.
Note
You can't apply more than one hierarchy to a chart.