Configure a navigator
You can configure a navigator for the following chart types:
Warning
The navigator will display and work correctly only if the X section of your chart contains a field of the Date or Date and time type.
To set up the navigator:
-
In the Chart settings window, enable the Navigator option. You'll see the following set of controls:

-
Select the navigator display mode:
-
All linesto display all chart lines in the navigator. -
Choose linesto display selected lines in the navigator.
-
-
Specify the Default period. Each time you open the chart, it'll display the last period corresponding to this setting.
Type
0or leave the field empty to display the complete range of values. -
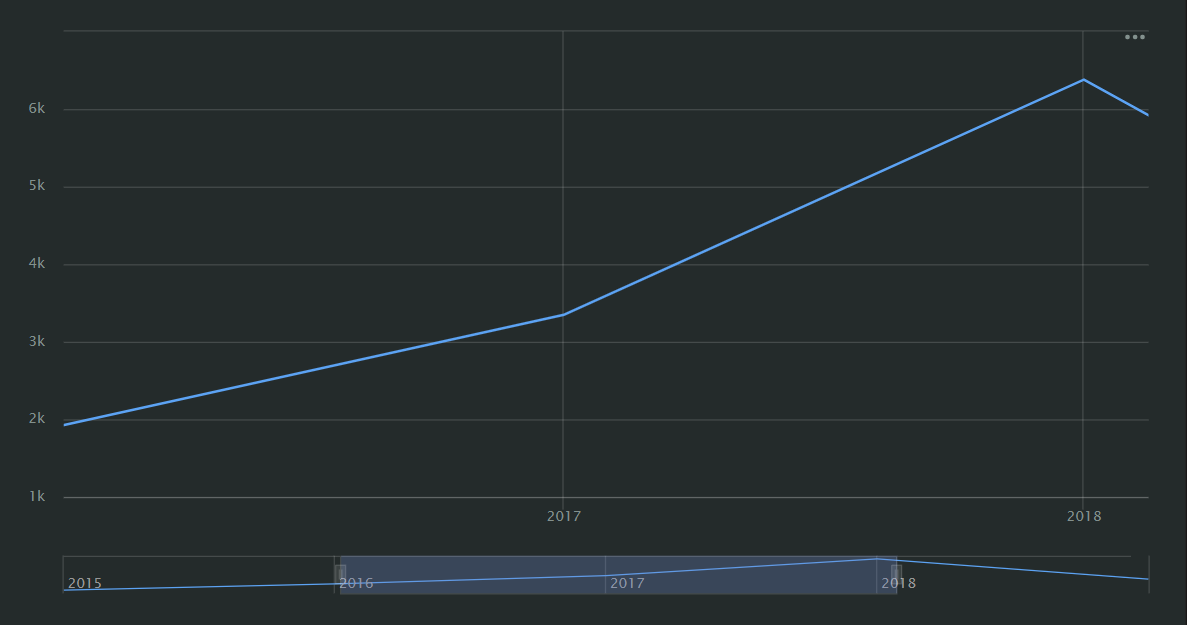
Click Apply. You'll see the navigator panel below the chart:

Previous