Data types in Visualization
Visualization works with various data source types. Data types in these sources might not correspond.
Visualization can process source data of the types listed below:
- Date
- Date and time
- Fractional number
- Integral number
- Boolean
- String
- Geopoint
- Geopolygon
- Array
- Tree of strings
- Markup
Date
Date is a YYYY-MM-DD date without time indication.
This data type in supported data sources:
| ClickHouse® | MySQL | PostgreSQL | Microsoft SQL Server |
|---|---|---|---|
date |
date |
date |
date |
Date and time
Date and time is a YYYY-MM-DD date with HH:MM:SS time.
This data type in supported data sources:
| ClickHouse® | MySQL | PostgreSQL | Microsoft SQL Server |
|---|---|---|---|
datetime |
datetimetimestamp |
timestamp |
datetimedatetime2smalldatetimedatetimeoffset |
Fractional number
Fractional number is a rational number with a decimal part.
This data type in supported data sources:
| ClickHouse® | MySQL | PostgreSQL | Microsoft SQL Server |
|---|---|---|---|
floatfloat32float64decimal* |
floatdoublenumericdecimal* |
realdoublenumericprecision |
floatrealnumericdecimal* |
Warning
The use of decimal data source type may lead to loss of accuracy.
Integral number
Integral number is a real number that doesn't contain a decimal part.
This data type in supported data sources:
| ClickHouse® | MySQL | PostgreSQL | Microsoft SQL Server |
|---|---|---|---|
integerint8int16int32int64uint8uint16uint32uint64 |
tinyintsmallintmediumintintegerbigint |
smallintintegerbigint |
tinyintsmallintintegerbigint |
Boolean
This data type in supported data sources:
| ClickHouse® | MySQL | PostgreSQL | Microsoft SQL Server |
|---|---|---|---|
boolean |
bit |
boolean |
bit |
String
String is a sequence of characters.
This data type in supported data sources:
| ClickHouse® | MySQL | PostgreSQL | Microsoft SQL Server |
|---|---|---|---|
stringenum8enum16 |
tinyblobblobbinaryvarbinarycharvarchartinytexttextenum |
charvarchartext |
charvarchartextncharnvarcharntext |
Geopoint
A Geopoint is a coordinate point defined by latitude and longitude. This type in Visualization is created via the GEOPOINT function casting an input value to a string of the following format: "[55.75222,37.61556]" where the number before comma is latitude and the number after the comma is longitude.
If your field data is already formatted this way, you can select the Geopoint data type in the wizard without using the GEOPOINT function.
This data type in supported data sources:
| ClickHouse® | MySQL | PostgreSQL | Microsoft SQL Server |
|---|---|---|---|
Set by the GEOPOINT function |
Set by the GEOPOINT function |
Set by the GEOPOINT function |
Set by the GEOPOINT function |
Geopolygon
Geopolygon consists of several coordinate points that form a polygon on the map. This type in Visualization is created via the GEOPOLYGON function casting an input value to a string of the format "[[[v1,v1], [v2,v2]], ..., [[vN-1,vN-1], [vN,vN]]]" where numbers before comma are latitude and the numbers after the comma are longitude.
If your field data is already formatted this way, you can select the Geopolygon data type in the wizard without using the GEOPOLYGON function.
This data type in supported data sources:
| ClickHouse® | MySQL | PostgreSQL | Microsoft SQL Server |
|---|---|---|---|
Set by the GEOPOLYGON function |
Set by the GEOPOLYGON function |
Set by the GEOPOLYGON function |
Set by the GEOPOLYGON function |
Array
Array is a structure that consists of multiple elements of the same type.
Visualization supports processing of dataset columns in one-dimensional arrays of the following element types:
-
Integral number:
[1, 2, 3] -
Fractional number:
[1.1, 2.2, 3.3] -
String:
["jam", "toast"]
Tree of strings
The Tree of strings data type is a tree-like hierarchy without a predefined number of levels.
Visualization supports trees as an array of strings that describes a full path to each node. The sequence of values in the array determines the sequence in which the tree expands.
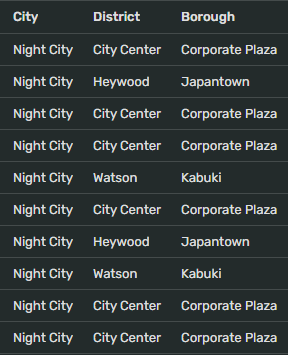
For example, your dataset has three columns with strings for each level of the hierarchy:

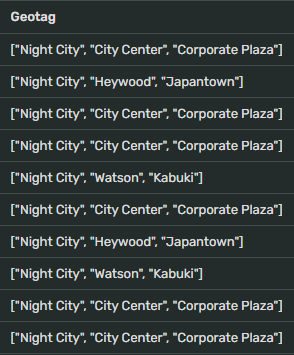
To prepare the data for use as a Tree of strings, create an array as a new calculated field named Geotag with the following formula:
ARRAY([City],[District],[Borough])
Your new field will look like this:

Its contents will look as follows:

To better understand how this array describes the structure of a tree, think like this:
The first string in the array is the top (city) level: ['Night City']
The second string is the second (borough) level: ['Night City', 'Heywood']
The third string is the next (district) level: ['Night City', 'Heywood', 'Japantown']
After creating the array, use the following formula to convert it into the new calculated field with the Tree of strings data type:
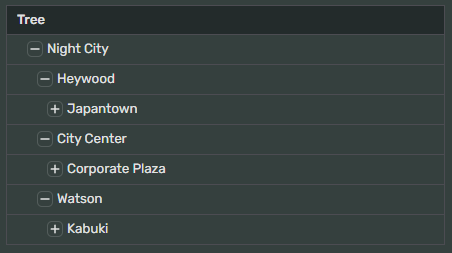
TREE([Geotag])
This is what your new field will look like in the dataset:

When added as Columns to a table, it'll render as follows:

You also can add a measure as a column to your table. It will distribute the values between the nodes of your hierarchy:

This data type has the following limitations:
-
Works in flat tables only. Pivot tables or any other charts aren't supported.
-
No pagination.
-
No totals.
-
You can't save the state of tree nodes.
-
One tree/hierarchy per table.
-
You can only add measures as additional columns.
Markup
The Markup type is produced by one of text markup functions. Markup is styled text from processed string values. Markup functions can also process already marked up text pieces and merge them as needed.
This data type in supported data sources:
| ClickHouse® | MySQL | PostgreSQL | Microsoft SQL Server |
|---|---|---|---|
| Set by the markup functions | Set by the markup functions | Set by the markup functions | Set by the markup functions |