The complete end-to-end DoubleCloud services guide
This comprehensive step-by-step scenario will give you an in-depth look at every major DoubleCloud resource. You'll familiarize yourself with how to create, manage, and make practical use of the resources in your brand new data management toolkit.
A typical use case for our service includes:
-
Creating a cluster and a database for data storage.
-
Transferring the data from the outside source to your DoubleCloud cluster.
-
Analyzing the data using Visualization, our built-in BI tool.
Let's look at the flow of this scenario:

There is a CSV file with some data we need to migrate to DoubleCloud and then analyze. To do this, we transfer the file from S3 to a Managed ClickHouse® cluster. From there, we connect our Visualization service to it, prepare the data, and build some impressive visualizations from it.
Following this straightforward step-by-step quickstart tutorial, you will learn how to:
Let's get to the point right now.
Step 1. Create a Managed ClickHouse® cluster
Warning
During the trial period, you can create clusters with up to 8 cores, 32 GB RAM, and 400 GB storage. If you need to raise the quotas, don't hesitate to contact our support.
Step 1. Configure resources
-
Go to the Clusters page in the console and click Create cluster at the top right.
-
Select ClickHouse.
-
Choose a provider and region. You can create Managed ClickHouse® clusters on AWS or Google Cloud in any of the available regions. By default, DoubleCloud preselects the region nearest to you.
-
In the Resources section, select between the x86 or ARM machine type and then select a resource preset that’s suitable for your expected workload.
For testing or development, you can select any preset. In production, ClickHouse® developers recommend having at least 16 GB of RAM.
ClickHouse® resource preset reference
A resource preset has the following structure:
<cpu-platform>-c<number-of-cpu-cores>-m<gigabytes-of-ram>There are three available CPU platforms:
-
g: ARM Graviton -
i: Intel (x86) -
s: AMD (x86)
For example, the
i2-c2-m8preset corresponds to an Intel-family machine with 2 virtual cores and 8 GB of RAM.Learn more about the availability of CPU platforms in areas and regions
-
-
Select the number of shards, number of replicas, and amount of RAM for your workload. For a high-availability configuration, make sure to select at least three replicas.
About shards and replicas
Replicas are ClickHouse® hosts that hold a copy of the data in the cluster or shard. Storing the same data in several replicas enables higher data availability and redundancy. Learn more
Shards refer to subsets of data. Sharding data across multiple servers allows you to distribute and divide the load so that you don’t exceed the capacity of a single server. Learn more
-
Under Basic settings, enter a cluster name, such as
clickhouse-dev. -
In Version, select the ClickHouse® version for the cluster. Unless you need a specific version, select the latest one.
Step 2. Configure advanced settings
-
Under Maintenance settings, select between the arbitrary and scheduled maintenance:
About maintenance settings
If you select Arbitrary, DoubleCloud selects the maintenance window automatically. Usually, maintenance takes place at the earliest available time slot.
Warning
If your cluster has only one host, arbitrary maintenance can make it unavailable at a random time.
To perform maintenance on a specific date and time, select By schedule and specify the day and time (UTC) when you want the cluster maintenance to be performed.
-
In Autoscaling, select whether you want the cluster resources to automatically scale and specify the maximum limits they can increase to.
If autoscaling is enabled, DoubleCloud regularly checks the resource utilization and automatically adjusts them depending on the cluster usage. Learn more
-
In ClickHouse Keeper hosts, select the deployment mode.
About ClickHouse Keeper hosts
In the embedded mode, ClickHouse Keeper shares hosts with ClickHouse®. In the dedicated mode, ClickHouse Keeper uses three separate hosts, which improves performance, availability, and fault tolerance. Learn more
For high-load production clusters, make sure to use dedicated ClickHouse Keeper hosts for better performance — when running on separate hosts, ClickHouse® and ClickHouse Keeper don’t compete for CPU and RAM.
Warning
You can’t change the ClickHouse Keeper deployment mode after creating the cluster.
For dedicated ClickHouse Keeper hosts, select the appropriate resource preset. It applies to all three hosts and is billed accordingly.
-
Under Networking → VPC, select the network where you want to create the cluster.
If you don’t need to place the cluster in a specific network, leave the preselected default option.
-
Specify or adjust your cluster’s DBMS settings. For more information, refer to Managed ClickHouse® settings reference.
-
In the Summary block on the right, review the resources to be created and their price.
-
Click Submit.
Creating a cluster usually takes five to seven minutes depending on the cloud provider and region. When the cluster is ready, its status changes from Creating to Alive.
To view the cluster details, select it from the cluster list:
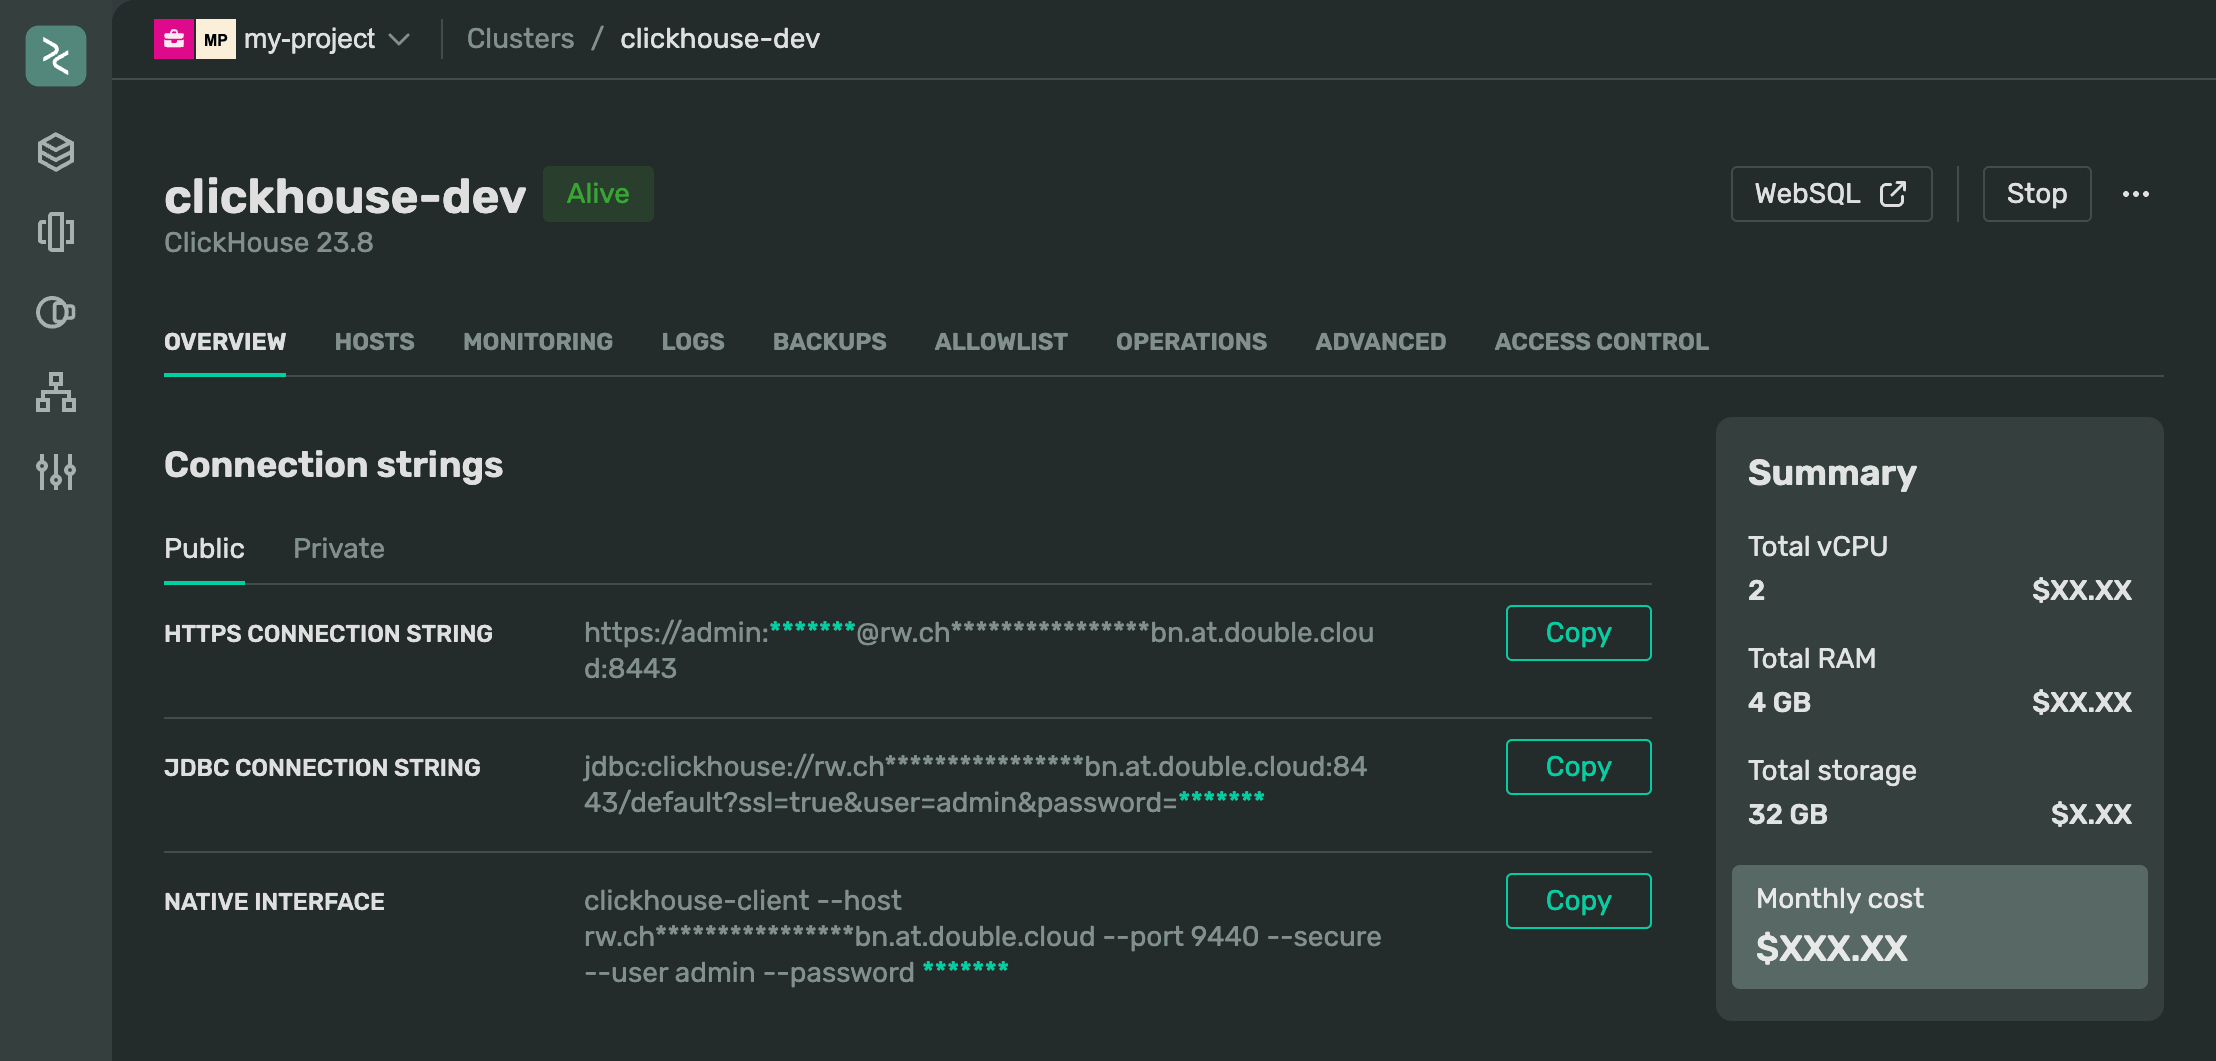
Creating a cluster usually takes from five to seven minutes depending on the cloud provider and region. When the cluster is ready, its status changes from Creating to Alive.
Tip
DoubleCloud creates the admin superuser and its password automatically.
You can the username and password under Credentials in the Overview tab on the cluster page.
To learn how to create users for other roles, refer to Manage ClickHouse® users
Create a ClickHouse® database
-
After the cluster status changes from Creating to Alive, select it in the cluster list.
-
Click WebSQL at the top right.
-
In WebSQL, click on any database in the connection manager on the left to open the query editor.
-
Create a new database named
sample_clickhouse_dbusing the following command:CREATE DATABASE IF NOT EXISTS sample_clickhouse_db -
Check if the database is available on the cluster. Type
SHOW DATABASES. You'll see the following readout:┌─name─────────────────┐ │ INFORMATION_SCHEMA │ │ sample_clickhouse_db │ // your database │ _system │ │ default │ │ information_schema │ │ system │ └──────────────────────┘
Tip
Alternatively, you can use a visual IDE of your choice to connect to a cluster and create a database.
Step 2. Transfer data
Now it's time to set up the tools to get the data from a remote source and transfer it to your sample_clickhouse_db ClickHouse® database. To accomplish this, you need to complete the following steps:
-
This is your data fetcher. It will connect to a remote source and send the data to your Managed ClickHouse® cluster.
-
This is your receiver. It will acquire the data sent by the source endpoint and write it to the database on your Managed ClickHouse® cluster.
-
Create and activate a transfer
This is your data pipeline tool. It will connect your endpoints and ensure the integrity of the data.
Step 2.1. Create a source endpoint
-
Go to the Transfer page in the console.
-
Click Create → Source endpoint.
-
In Source type, select Object storage.
-
Under Basic settings:
-
Enter the Name of the endpoint:
s3-source-quickstart. -
(optional) Enter a Description of the endpoint.
-
-
Specify endpoint parameters under Endpoint settings:
-
Specify the Dataset:
bookings. -
Provide the Path pattern:
data-sets/bookings.csv. -
Keep the Schema field with its default value.
-
From the drop-down menu, select the data format -
CSV.
-
-
Under CSV, specify the Delimiter -
;. Keep the rest of the fields with their default values. -
Under S3: Amazon Web Services, enter the name of the Bucket:
doublecloud-docs. As the bucket is public, leave the rest of the fields blank. -
Optionally, you can test your source endpoint:
-
Click Test connection.
-
Select the runtime type you want Transfer to use for connecting to the database.
-
Dedicated: Transfer connects to the database using a specified internal or external network.
-
Serverless: Transfer connects to the database available from the internet using an automatically chosen network.
Runtime compatibility warning
Don't use endpoints with different runtime types in the same transfer — this will cause the transfer to fail.
-
-
If you selected the dedicated runtime, select the network in the dropdown.

-
Click Test connection.
Testing the connection may take a few minutes.
-
-
Click Submit.
The transmitter is ready to go. We need to create an endpoint to receive the data from a remote source.
Step 2.2. Create a target endpoint
-
Go to the Transfer page in the console.
-
Click Create → Target endpoint.
-
In Target type, select ClickHouse.
-
Under Basic settings:
-
Enter the Name of the endpoint:
clickhouse-target-quickstart -
(optional) Enter a Description of the endpoint.
-
-
In Connection settings → Connection type, select Managed cluster.
-
In Managed cluster, select clickhouse-dev from the dropdown list.
-
In Authentication, select Default to connect to the cluster as the
adminuser. -
In Database, enter
sample_clickhouse_db— the name of the database you created earlier. -
Leave all the other fields blank or with their default values.
-
Click Submit.
Good work. We've created an endpoint to receive and write the data to your ClickHouse® database. Now we need a tool that will connect both endpoints and transfer the data.
Step 2.3. Create and activate a transfer
-
In the list of services, select Transfer.
-
Click Create transfer.
-
Under Endpoints:
-
Select
s3-source-quickstartfrom the Source drop-down menu. -
Select
clickhouse-target-quickstartfrom the Target.
-
-
Under Basic settings:
-
Enter the transfer Name:
transfer-quickstart -
(optional) Enter the transfer Description.
-
-
Leave all the other fields blank or with their default values.
-
Click Submit. You will see the following line on your Transfer page:

-
After you've created a transfer, click → Activate.
-
Wait until your transfer status changes to
Done.
Check the data transferred to your ClickHouse® database:
-
Open WebSQL.
-
In WebSQL, click on any database in the connection manager on the left to open the query editor.
-
Run the following command:
SHOW TABLES FROM sample_clickhouse_db┌─name─────┐ │ bookings │ └──────────┘
Nice work! You have all the data transferred from a remote source and replicated with complete integrity in your own ClickHouse® database. Now let's make this data earn its worth.
Step 3. Visualize the data
After migrating the data to your Managed ClickHouse® cluster, it's time to start building data displays. This process consists of the following steps:
-
In Visualization it works as a container for all other visualization elements.
-
This tool connects to your Managed ClickHouse® cluster to fetch and update the data.
-
Create a dataset based on the data from your connection and prepare it for visualization.
-
This tool provides a canvas on which to place and organize charts.
-
Create charts to visualize your data.
Step 3.1. Create a workbook
Workbooks are visualization environments for data in your projects.
-
Open the Visualization page in the console.
-
Click Create → Create workbook in the upper-right corner of the page. You'll see the following dialog:

-
Under Name, type
Booking Demo Workbook. -
Under Description, paste the following:
This workbook contains a connection, a dataset, charts and a dashboard for the complete end-to-end DoubleCloud scenario. -
Click Create. The new workbook page will look as follows:

Let's fill in all its sections.
Step 3.2. Create a connection
Connections access hosts in your cluster to fetch data for processing and visualization.
-
Click Create → Connection in the upper-right corner of your workbook page.
-
Select ClickHouse®.
-
Specify the connection parameters:
-
Hostname. Copy the name of a host from the Hosts tab on your cluster's information page.
-
Username and Password from the Overview tab on the information page of your cluster.
-
Leave all the other fields with their default values.
-
-
Click Check connection.
If your connection is operational, you'll see a green icon. A red icon and a popup message with information about the error will appear if there's a problem.
Your connection parameters should look like this:

-
Click Create connection in the upper-right corner of the page.
-
In the dialog, name the connection
ClickHouse DBand click Create.
Step 3.3. Create a dataset
Datasets process data from your connections and prepare them for visualization.
-
In the upper-right corner of your connection page, click Create dataset.
-
In the Connections section, you'll see your new connection, and under it - the table you can use to create a dataset.
You'll see the
sample_clickhouse_db.bookingstable in the workspace on the right. The preview of the resulting dataset will appear in the Preview section below.Your dataset configuration should look similar to this:

-
Click Save in the upper-right corner of your dataset page.
-
In the dialog, name the dataset
Bookings Datasetand click Create.
Step 3.4. Prepare your dataset for visualization
Use calculated fields and aggregation to extract more value from your data.
-
In the top-left corner of your dataset page, select
Fields.Let's look at the list of fields we've got here. The first column is
Row_num- this isn't the best option for a sorting field.What's the best sorting parameter for a bookings dataset? It should be some sort of time indicator
Where do we get the appropriate values? Let's look at the dataset again. There is the
booking_start_datefield. It's a timestamp with the standardYYYY-MM-DDstructure transferred as a string. We need to parse it into a more useful data type. -
Create a calculated field to extract the year number from this data column:
-
Click + Add field button in the top right to create a calculated field.
-
Under Field settings specify the name for the field:
Booking Start Date. -
Use the DATE_PARSE function in the formula:
DATE_PARSE([booking_start_date]) -
Click Create in the lower-right corner.
You'll see the new calculated field on the top of the dataset field list. It will have the icon in the Field source column:

-
Hide the
Row_numcolumn since we won't use it:-
Hover the cursor over
Row_numin the list of dataset fields. -
Click the icon.
-
The field is now hidden and will be unavailable for visualization. It as also disappeared from the Preview section of the dataset.
-
-
Click Save in the upper-right corner of the dataset page to save changes.
Now the data is ready for visualization. Let's get right to it.
Step 4. Create charts
To get you familiar with the most popular chart types in DoubleCloud Visualization, we'll create the following:
Step 4.1. Create a stacked area chart
A Stacked area chart is good at showing how value changes over time.
-
In the upper-right corner of your workbook page, click Create → Wizard chart.
-
Select
Bookings Datasetfrom the list. -
Click the chart type field on the right of the dataset section and select Stacked area chart from the drop-down menu.
-
Drag and drop Measures and Dimensions to the appropriate sections of the chart:
-
Booking Start Dateto X - this provides the timeline over which the data was changing. -
Priceto Y - these are the value changes we want to visualize.
Your chart fields configuration should look like this:

-
-
Now let's change the default blue color of the chart into something with a bit more zest:
-
Hover your cursor over the Colors field and click .
-
In the popup window, select a different color for the
Price sumfield. -
Click Apply.
-
-
Click Save in the upper-right corner of the page.
-
Let's call our chart
Priceand click Save.Your stacked area chart should look similar to this:

-
Go back to your workbook page by clicking Booking Demo Workbook in the breadcrumbs at the top.
Tip
If you want to practice creating area charts a bit more, create a similar chart, but make it about Average price - choose the Price avg field for your Y field.
Step 4.2. Create a bar chart
A Bar chart allows you to compare the same parameter across several categories. For example, we'd like to know the number of bookings in each borough and compare them at a glance. Let's make it happen:
-
Click Create → Wizard chart.
-
Select
Bookings Datasetfrom the list. -
Click the chart type field on the right of the dataset section and select Bar chart from the drop-down list.
-
Drag and drop Measures and Dimensions to the appropriate sections of the chart:
-
boroughto Y - these are our categories. -
booking_id_to X - this is the parameter we want to compare between the categories. -
boroughto Colors - this will paint horizontal bars in different colors to make the data easier to read. -
booking_id_to Signatures - this will write the numeric values inside the bars.
Your chart fields configuration should look like this:

-
-
Let's call our chart
Bookings by Boroughand click Save.Your bar chart should look similar to this:

-
Go back to your workbook page by clicking Booking Demo Workbook in the breadcrumbs at the top.
Tip
If you want to practice creating bar charts, create a similar chart, but make it about ratings rather than bookings - choose the rating_overall field for your X and Signature fields.
Step 4.3. Create an indicator
An indicator shows a numeric value or a sum of values in large letters.
-
Click Create → Wizard chart.
-
Select
Bookings Datasetfrom the list. -
Click the chart type field on the right of the dataset section and select
Indicatorfrom the drop-down list. -
Drag and drop
host_idto the Measure field.This will automatically sum up all the values in the field. However, we need to count the number of unique IDs, so we'll have to create a calculated field for this indicator.
-
Click the icon to the right of the field name in the wizard slot.
-
In the Field settings window, let's rename the field into
hosts count. -
Paste the following formula into the code field below:
COUNT(INT([host_id])) -
Click Save.
-
Let's customize the appearance of our indicator:
-
Hover your cursor over the Measure field and click .
-
In the popup window, select the
Ssize and choose a different color. -
Click Apply.
-
-
Click Save in the upper-right corner of the page.
Your indicator should look similar to this:

-
Let's call our chart
Hosts Count Indicatorand click Done.
Tip
If you want to practice creating indicators, create a similar chart, but choose the booking_id field for your Measure field and select a different color for the numbers.
Step 5. Create a dashboard
A dashboard is a customizable data display that allows you to arrange charts, selectors and widgets.
-
Click Booking Demo Workbook in the breadcrumbs.
-
On your workbook page, click Create → Dashboard in the upper-right corner of your workbook page.
-
Call it
Booking Dashboardand click Create.Your dashboard will open in edit mode. You're ready to start populating it with tabs and charts.
Step 5.1. Add charts to your dashboard
-
Click Add → Chart. You'll see the chart placement dialog:

-
Under Chart, click Select and choose the
Pricechart from the list. -
You'll see the chart's Title appear in the relevant field. To the right, there's the Show checkbox - let's keep it as is.
-
Click Add.
-
Move the chart around the dashboard and resize it if needed.
-
-
Add the other charts the same way and arrange them to your liking.
Step 5.2. Add a selector
Selectors can work as filters for your charts and give you additional analytical flexibility.
-
Click Add → Selector.
-
Keep the Based on dataset mode selected.
-
From Dataset, select
Bookings dataset. -
From Fields, select
property_type. -
In the Selector type field, keep
List. -
Under Operation, select Belongs to a set from the drop-down menu.
-
Toggle Multiple choice on.
-
In the Title field, enter
Property type. -
Click Save
Now you can filter your charts by one or more property types. Give it a try.
Tip
If you want to practice creating selectors, create a similar one, but choose Borough under Field.
After working with charts, click Save in the upper-right corner of the page to save the changes to the dashboard.
Below you can see a tab with sample data and layout:

Add a sample dashboard to any project
You can add this sample dashboard to any of your projects - click Add demo workbook in the upper-right corner of your All workbooks page.
This concludes the tutorial. There's a lot more you can do with DoubleCloud. Keep exploring!
See also
Managed Service for ClickHouse®
- Connect to a ClickHouse® database
- Upload CSV to ClickHouse®
- Upload Parquet to ClickHouse®
- Use the hybrid storage for the DoubleCloud Managed ClickHouse® clusters