
Transforming businesses with user-facing analytics: the power of data analytics in driving growth and optimization
How data analytics is transforming your (and your customers’) businesses
There has been an extraordinary surge in the sheer volume of data. And it comes as no surprise that for any business to grow, it needs to use data effectively. In the contemporary landscape, data analytics is no longer limited to the users of one company. Now, it extends its benefits to customers and partners, empowering them to expand their businesses as well. Analytics is critical to optimizing operations and performance, providing actionable insights about your product, and even generating new revenue streams, thereby increasing overall profitability.
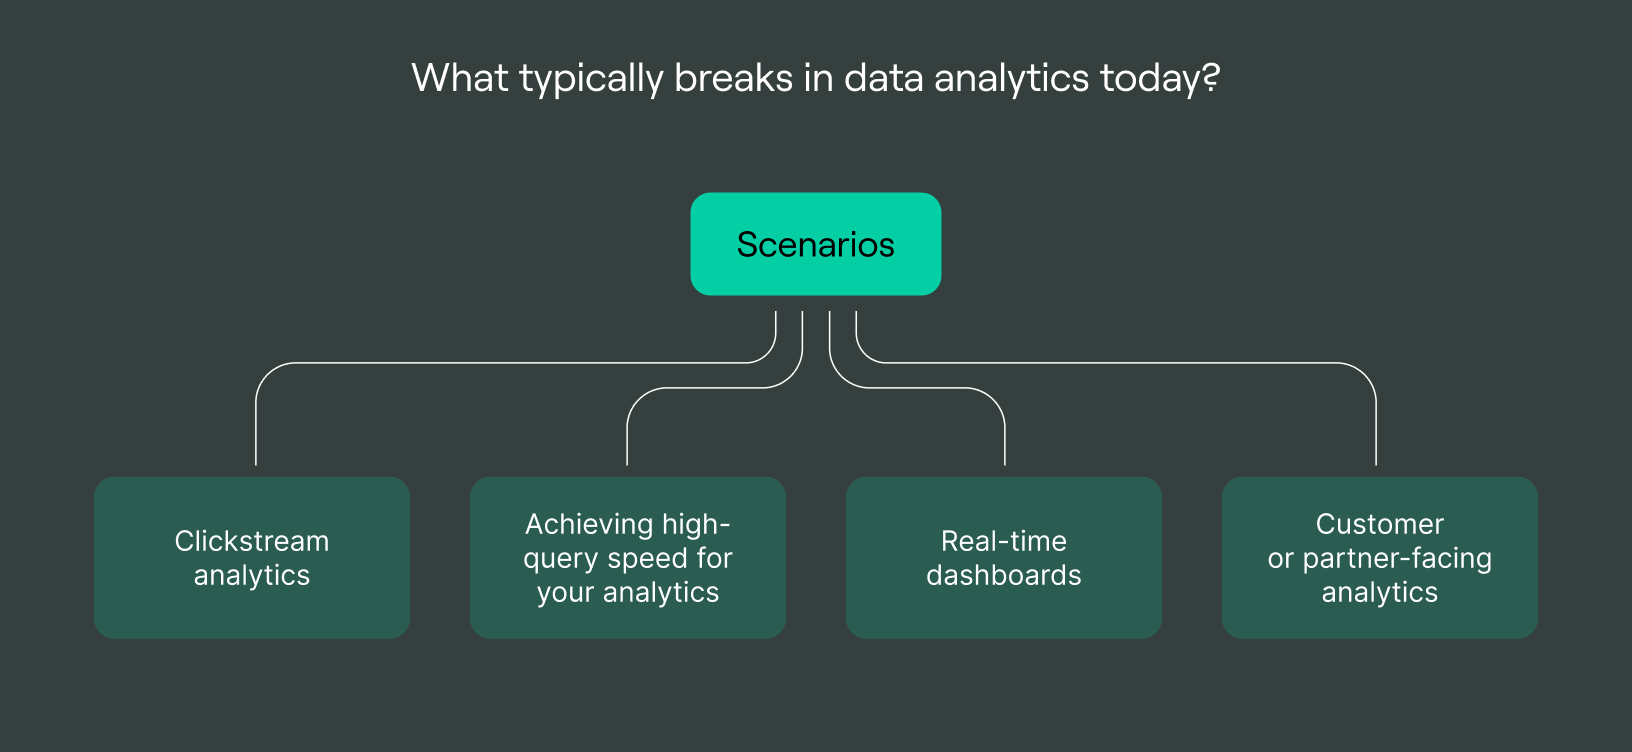
In this article, we’ll talk about:
What’s new in data analytics?
Emerging trends:
-
Scenarios of development.
-
Clickstream analytics.
-
Fast query performance
-
Real-time dashboards.
-
Customer or partner-facing analytics.
-
DoubleCloud
According to a recent Gartner survey, 75% of executives plan to invest in customer-focused applications that are aimed at improving customer service quality. Business leaders expect providers to deliver analytics in less than 10 seconds. We offer a solution that meets all modern challenges in speed, availability, security, and cost-value, whether you provide an e-commerce or retail solution, develop games, use AdTech, or EdTech platforms, or offer SaaS products.
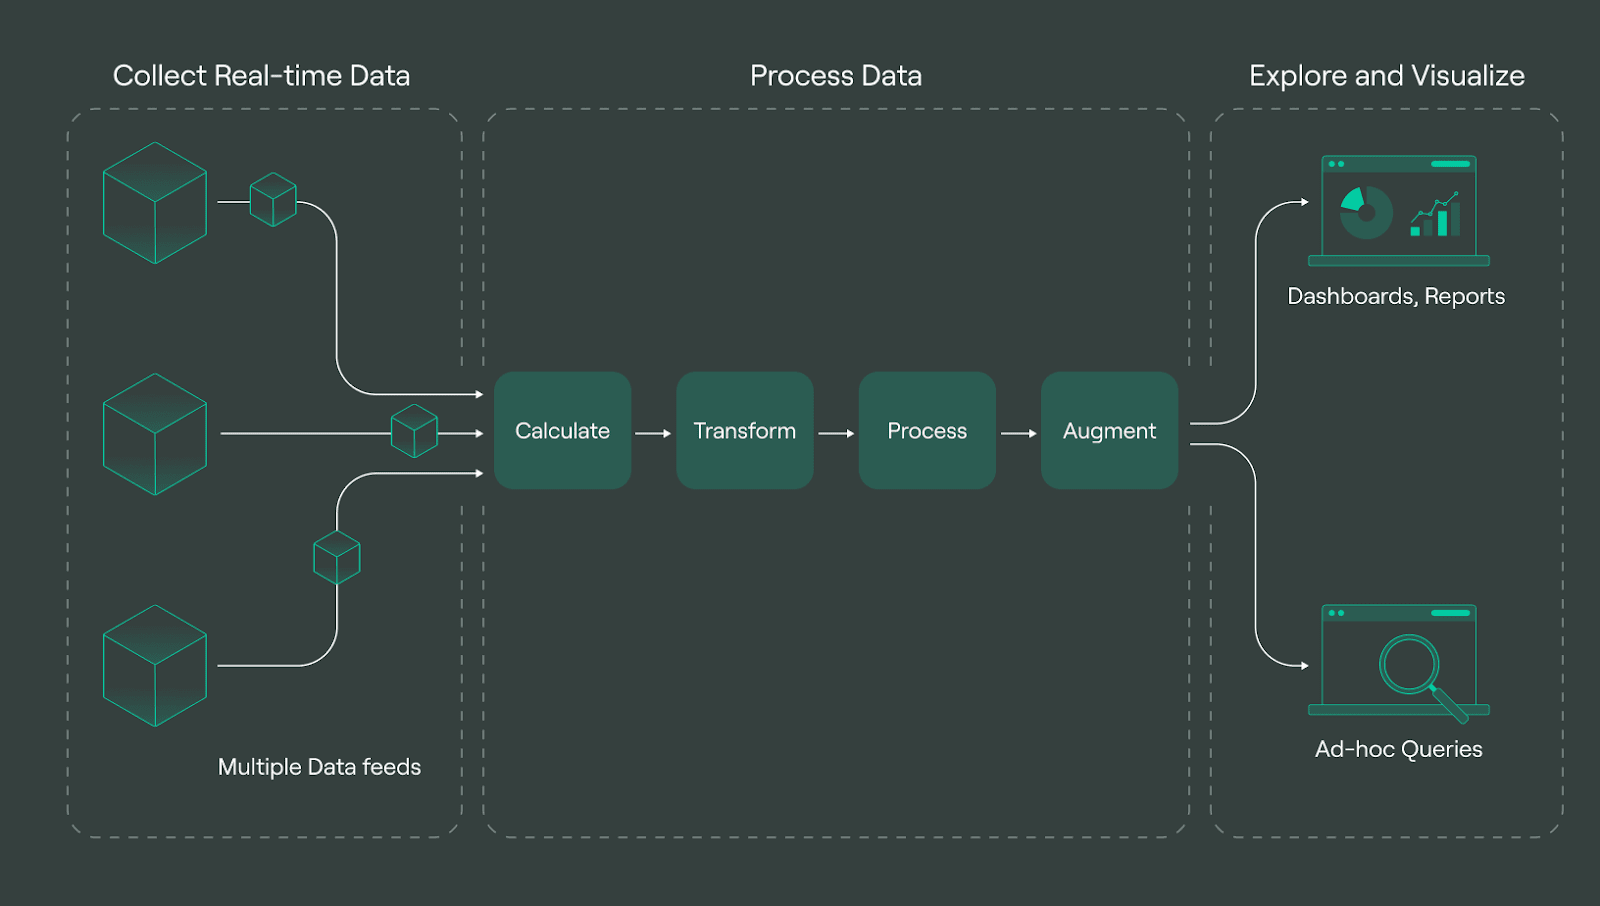
Instead of running occasional analytics queries on historical data, a new type of application is required to deliver subsecond analytics and queries on both real-time and historical data, including stream and batch processing. Since real-time analytics applications have no tolerance for data loss or downtime, they become indispensable tools for enabling real-time decision-making. Some of their core components include data sources, data transfer, databases, and visualization.
Facts and figures:
-
1. Data-driven organizations are 23 times more likely to acquire customers, 6 times more likely to retain customers, and 19 times more likely to be profitable (Mckinsey Global Institute)
-
2. 81% of organizations also agree that data should be at the heart of all business decision-making. (EY)
-
3. Companies that are monitoring data, according to 69%, make better strategic decisions, and 52% stated that they have a better understanding of their customers. (BARC research)
-
4. 62% of retailers (and 63% of cross-industry respondents) have stated that information and data analytics give them a competitive advantage. (IBM)
-
5, A 10% increase in data usability could increase the average Fortune 1000 company’s revenue by over $2 billion (University of Texas, Austin)
User-facing analytics: what is user-facing analytics?
According to a Deloitte survey, 49% of respondents believe that analytics help them make better, more informed decisions. Moreover, the advantages of data analytics extend beyond just the company itself: business partners and customers can also benefit from them. Different types of analytics, such as those aimed at customers, users, and partners, have been developed to accommodate the needs of various types of end users. Let’s take a closer look at these categories.
User-facing or customer-facing analytics are built into a service or product offered by a business. Its key features include:
-
Scalability and performance: Consider a marketing platform that provides analytics to its clients — advertising agencies. Each agency can manage budgets for dozens or hundreds of clients, and for effective management, they need real-time analytics that work quickly, provide the necessary level of data detail and granularity, and even generate insights based on the data.
-
Security and reliability: Let’s look at the previous example. Each agency using a MarTech platform needs safe, protected, and dependable access to its data, reports, and dashboards. Customers should also be able to control their access levels.
-
A pricing model that can be scaled: A model based on overall data volume works much better than a user-based licensing model.
-
Accessibility: It is critical to have access to analytics from both the app and web interfaces.
-
Scalability: As a service provider, maintaining a Service Level Agreement (SLA) is crucial, and analytics are often an integral part of that agreement. Downtime or disruptions in the analytics service can have severe consequences, including client churn.
Partner-facing analytics is designed for partners’ or customers’ employees to assess and control business operations. To put it another way, it is a business intelligence (BI) tool for the end user. The following features are critical for its operation:
-
Reliability and consistency of operation: Returning to our product example, the system is connected to a vast network of restaurant partners, similar to Uber Eats. They need to have real-time access to such data as the number of orders, average order size, delivery times, integrations to update menu availability, and so on. With this information at hand, partners can manage their businesses and scale faster.
-
Data retrieval from multiple sources
-
Predictable ownership costs that are not tied to the number of licenses or seats.
-
Flexible visualization tools.
Regardless of the use case, defining partner or customer requirements and setting performance expectations (response time, data freshness, etc.) are critical when it comes to insights.
Building analytics for external users requires technical considerations and a flawless user experience. External users, for example, will not tolerate even a few seconds or minutes of waiting for a report to generate, long periods of downtime, or inconvenient maintenance windows. Delays can have a significant impact on their revenue, decision-making, and overall business operations or strategy.
|
Speed and performance |
Security and compliance |
High availability and scalability |
Cost efficiency |
|
Fast data loading and great UX. great UX |
When dealing with external users, the confidentiality of information and the security of access to internal infrastructure are critical. |
Analytics are part of any service’s SLA, and any downtime could cause you to lose customers or business partners. |
A fixed cost that is not based on the number of seats or licenses. |
Some of the key features of user-facing analytics are:
-
Data visualization tools: you need to be able to make and set up dashboards and graphs to see and analyze data from different sources without the help of data engineers. Data analysts cannot rely on infrastructure or engineering teams to provide them with dashboards and datasets, due to their extensive workloads.
-
Self-service capability: you should be able to create charts and dashboards on your own.
-
Cloud-based options: designed to operate seamlessly across various cloud infrastructures.
-
Performance: fast data load time. According to recent studies, response time is critical for analytics report users. The maximum acceptable response time is 5 seconds. When dealing with a large amount of data, there is a trade-off between analyzing all of the data for an extended period of time and using a small sample.
User-facing analytics vs BI
While user-facing analytics and traditional business intelligence (BI) tools share many similarities, the main difference is that user-facing analytics are available to end users directly within the app they are using. Unlike with BI applications that are separate entities, users will not have to disrupt their current workflow or context in order to gain access to insights.
Moreover, user-facing analytics tools eliminate the limitations of technical complexity as well as the need for IT management and maintenance of dashboards and data visualizations. As a result, users with varying levels of technical or analytical knowledge can easily access the data without encountering any technical challenges.
Build versus buy: that is the question (or is it?)
Many businesses lack the necessary expertise and availability to develop an optimal user-facing data analytics solution. As a result, developers face significant challenges in data analytics projects, with the primary obstacles being a lack of skills or expertise (24.13%) and a lack of resources (21.12%), according to SlashData.
In addition to the engineering resources required for in-house development and maintenance of such a solution, adherence to industry standards is important to make sure that the analytics solution is:
-
Scalable: move from simple to complex analytics.
-
Adaptable: easy to make changes.
-
Manageable: ensure a consistent experience as the user, customer, and partner base expands.
That is why most businesses would rather pay for a solution (and peace of mind) that guarantees a fast time to market, top-notch security, low ongoing costs, and few, if any, in-house developers.
According to SlashData, 40.59% of developers use fully-managed open-source tools (cloud-based services), while 28.98% are not involved in any data analytics projects.
Using DoubleCloud to deliver user-facing analytics
Many SaaS, AdTech, EdTech, eCommerce, and gaming providers require extensive customer-facing and partner-facing analytics. User-facing analytics allow end users or partners to gain valuable insights, improve decision-making, optimize operations, and even boost revenue. When deciding whether to build a solution in-house or purchase it from an external provider, consider the resources needed for development and maintenance, as well as the complexity of self-service analytics.
By leveraging integrated and open-source technologies such as ClickHouse and Apache Kafka, DoubleCloud helps organizations develop cost-effective sub-second analytical applications. In addition to being a fast and easy data warehouse, DoubleCloud’s products complement one another, facilitating the creation of full-fledged solutions for your user-facing analytics.

Yango Tech launches real-time partner analytics with minimal time-to-market
Launching all their partner-facing analytics MVP only took a week
The DoubleCloud solution for user-facing analytics consists of three key components that allow you to aggregate data, add it to a managed cluster, and create dashboards:
-
1. Transfer tool (draws data from various sources)
-
2. Managed clusters (for ClickHouse and Apache Kafka)
-
3. Visualization tool (creates simple, quick, and powerful dashboards)
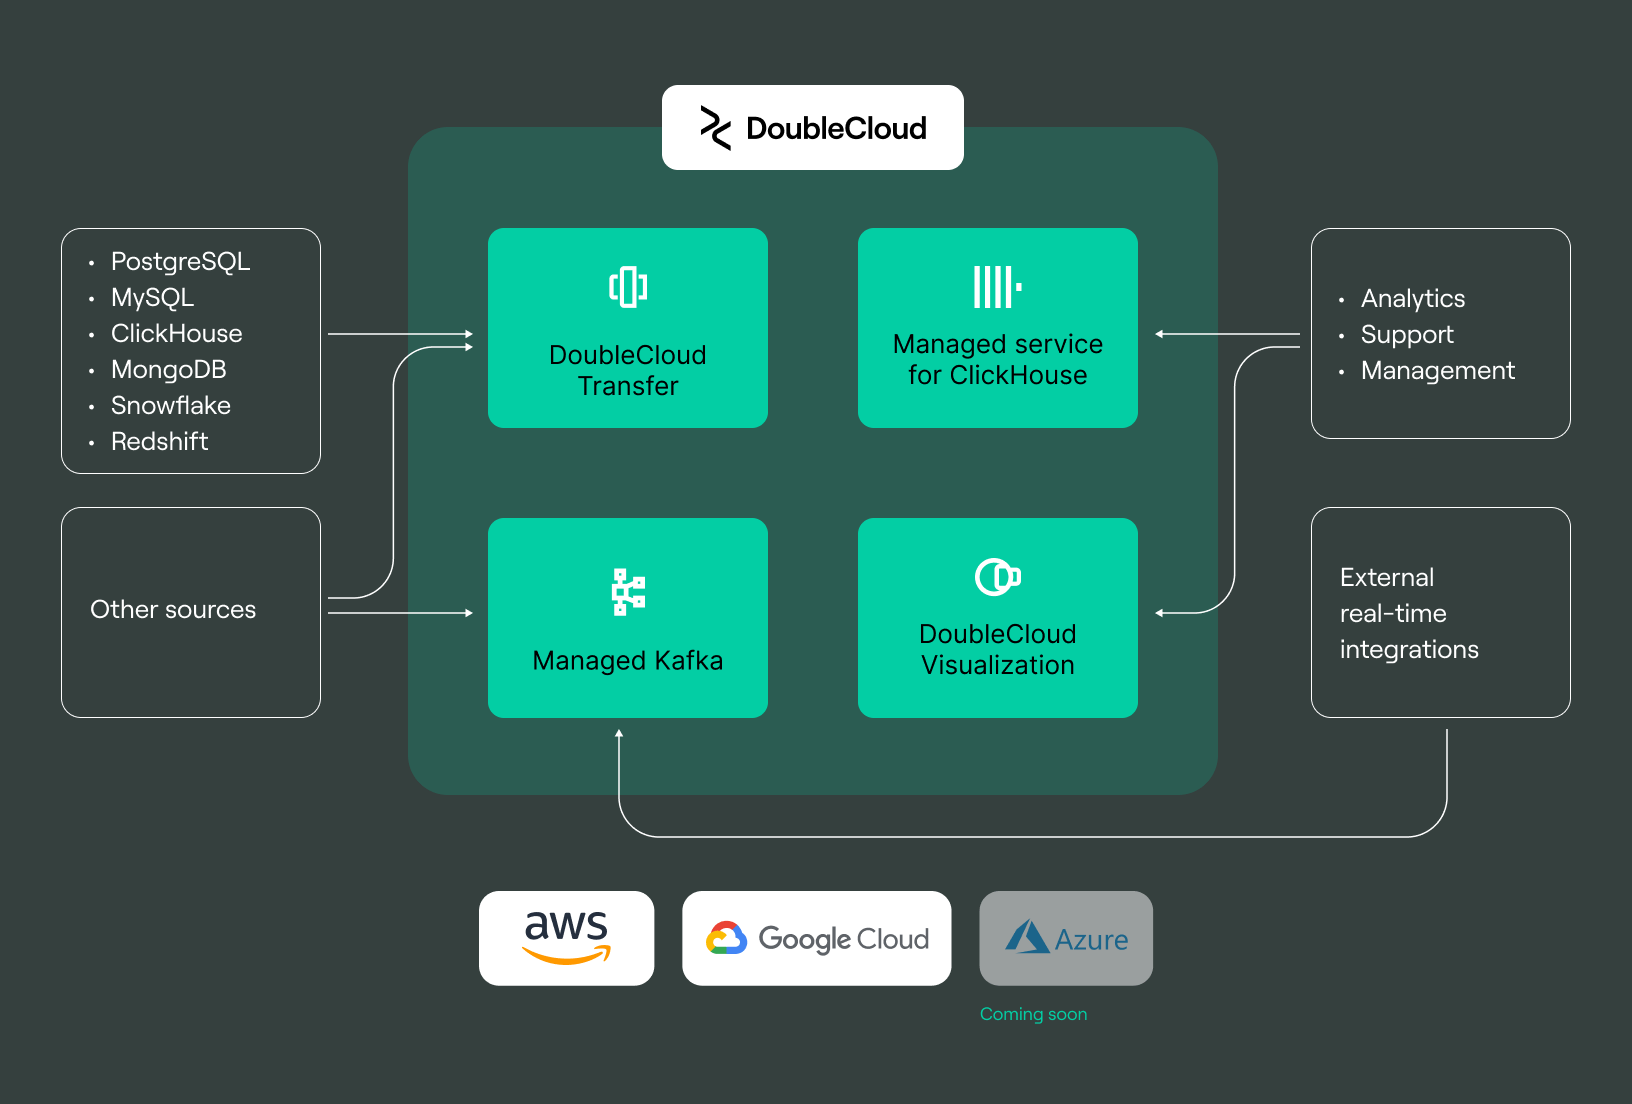
ETL and visualization as a SaaS, with managed services for top-tier open-source technologies.
Let us take a closer look at how each component works:
1. DoubleCloud Transfer
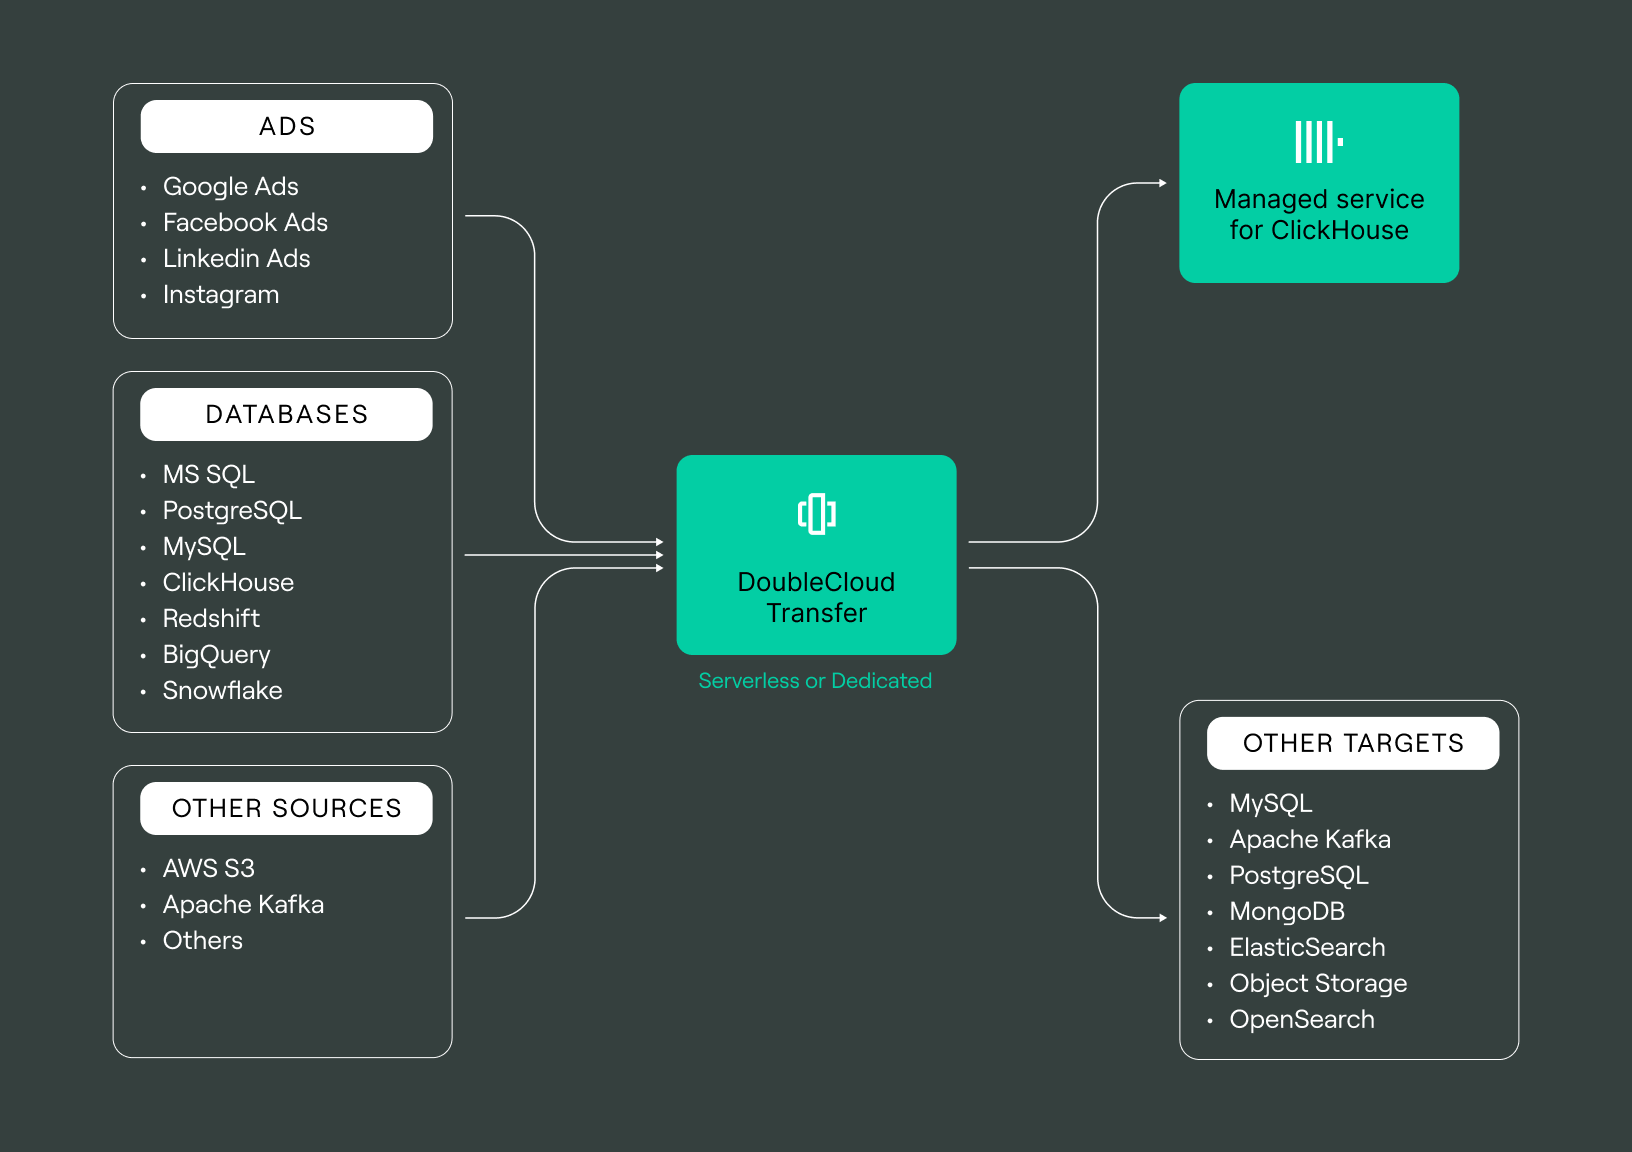
DoubleCloud Transfer is a cloud-agnostic data service specifically built for extract-and-load operations, enabling seamless logical data transfers between storage systems. Its primary function is to facilitate swift and secure migrations of databases across different cloud platforms, local databases, and DoubleCloud’s managed database services.
The Transfer tool provides a variety of connectors for popular databases such as PostgreSQL, MySQL, and Snowflake, as well as integration with various SaaS services. It enables users to easily copy or replicate data between databases and stream processing services by configuring transfers between endpoints. To learn how to set up Transfer, check out this video tutorial.
2. DoubleCloud Managed Service for ClickHouse®
The managed service for ClickHouse, an open-source column-oriented DBMS designed for online analytical processing, allows users to set up a new data cluster in just 5 minutes and generate analytical reports with SQL queries in real time. Another advantage of using the service is the ClickHouse hybrid storage, which can cut storage costs by up to fivefold.
The other type of managed cluster is Apache Kafka, which serves as a distributed event store and stream-processing platform. It is used in gaming industry platforms, IoT applications, and log management and is ideal for scenarios requiring distributed delivery, storage, and real-time data processing. Learn how to set it up here quickly.
Both managed ClickHouse and managed Apache Kafka services by DoubleCloud support bring your own account (BYOA), allowing you to deploy either service in your AWS account while retaining access to the DoubleCloud management console.
According to SlashData, 16.5% of developers use ClickHouse for data analytics projects.
3. DoubleCloud Visualization
The DoubleCloud Visualization is a serverless, no-code, free business analytics tool that allows you to visualize your data, create dashboards, and then share the results. Metrics can be monitored in real-time as they are updated from various data sources, allowing for more informed decision-making.
-
Visualization includes a native interface for customizing and creating new reports and dashboards.
-
Access to data can be restricted at the report or dashboard level (useful for internal BI use cases).
-
It is compatible with the Transfer tool and can connect to a variety of common data warehouses via a connector, allowing you to generate insights without deploying a ClickHouse cluster, configuring data transfer from existing systems, or replacing existing data infrastructure.
The supported connection sources include ClickHouse (managed or on-premise), PostgreSQL, MySQL, MS SQL Server, Snowflake, BigQuery, and the option to visualize data from a CSV file. Watch this video to set it up.
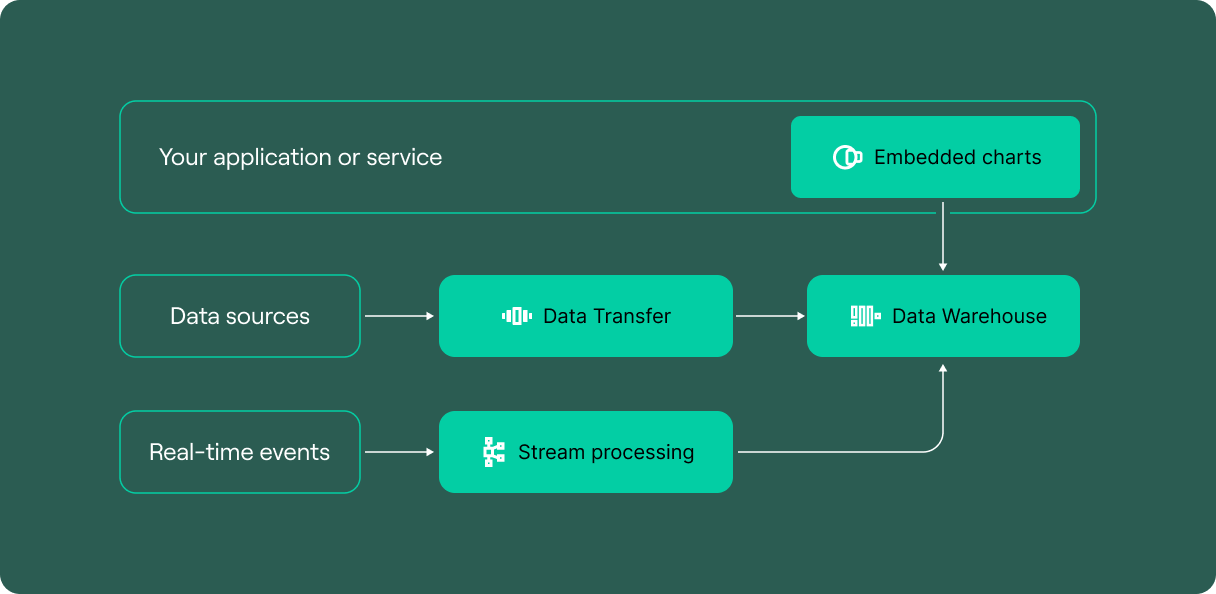
A new feature of DoubleCloud that allows users to embed analytics directly in your app or website
What sets DoubleCloud’s visualization platform apart from other third-party BI tools?
Since your data comes from different sources, you have to do a lot of configuration for any BI tool. The Visualization tool makes it simple to collect and connect data from various sources and can be used for free without the need to invest in a BI vendor.
Here are some additional benefits of using the DoubleCloud end-to-end data stack:
-
Time to value
-
Speed and performance
-
Security (check out the DoubleCloud Trust Report for more information)
-
Cloud-agnostic and BYOA-accessible
-
No vendor lock-in and open-source
-
Out-of-the-box integration that is simple to set up in just a few clicks
Final words
In conclusion, user-facing analytics emerge as a transformative tool for businesses, fostering growth and optimization by extending data insights not just internally, but also to customers and partners. This approach presents a compelling alternative to traditional business intelligence tools, offering value by integrating directly within the app or product users are already engaged with. The decision to build or buy a user-facing analytics solution hinges on various factors, but the Double Cloud solution offers a cost-effective and efficient way to deliver these analytics. By harnessing the power of user-facing analytics, businesses can enhance user experience, drive engagement, and unlock new avenues for growth.
Get started with DoubleCloud


