
Visualize your ClickHouse storage with DoubleCloud
Written By: Amos Gutman, DoubleCloud Senior Solution Architect
Once upon a time, in the land of data and analytics, there was a powerful tool called ClickHouse, used by many to store and manage vast amounts of data. As the data grew, so did the need to visualize the usage of disk space across storage, databases, tables, and table parts. Enter DoubleCloud, a valiant hero in the realm of data visualization, with its trusty treemap visuals to help users better understand their ClickHouse storage.
In this blog post, we will guide you on a journey to create an enlightening SQL query within DoubleCloud and then demonstrate how to construct a beautiful dashboard that reveals the disk space usage and free space for each element in your ClickHouse storage.
Our story begins with a single SQL query that we shall craft within DoubleCloud. This query will extract the information we need to visualize our storage:
select if(parts.disk_name=='' or isnull(parts.disk_name),'Empty',parts.disk_name) as disk,database, tables.name,parts.name ,parts.bytes_on_disk
from system.tables
        full outer join system.parts
                        on parts.database = tables.database and parts.table = tables.name
where database not in (['_system','system'])
union all
select name,'free_space','free_space','free_space', free_space
from system.disks
where name = 'default'
With this magical query, we will obtain the disk, database, table name, table part, and bytes on disk for each entry. Additionally, the query will also fetch the free space left on the disk.
Now, let’s explore the enchanted world of DoubleCloud and create a dashboard to visualize this data. We will add some screenshots along the way to ensure you won’t get lost in the forest of data.
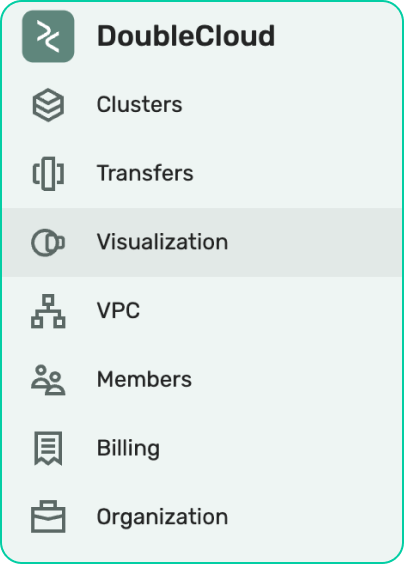
First, log in to your DoubleCloud account (https://app.double.cloud/) and navigate to the Visualization screen.
Create a workbook
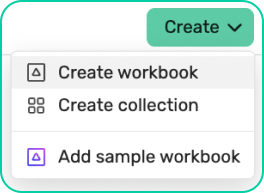
Provide a name like “Storage explorer”

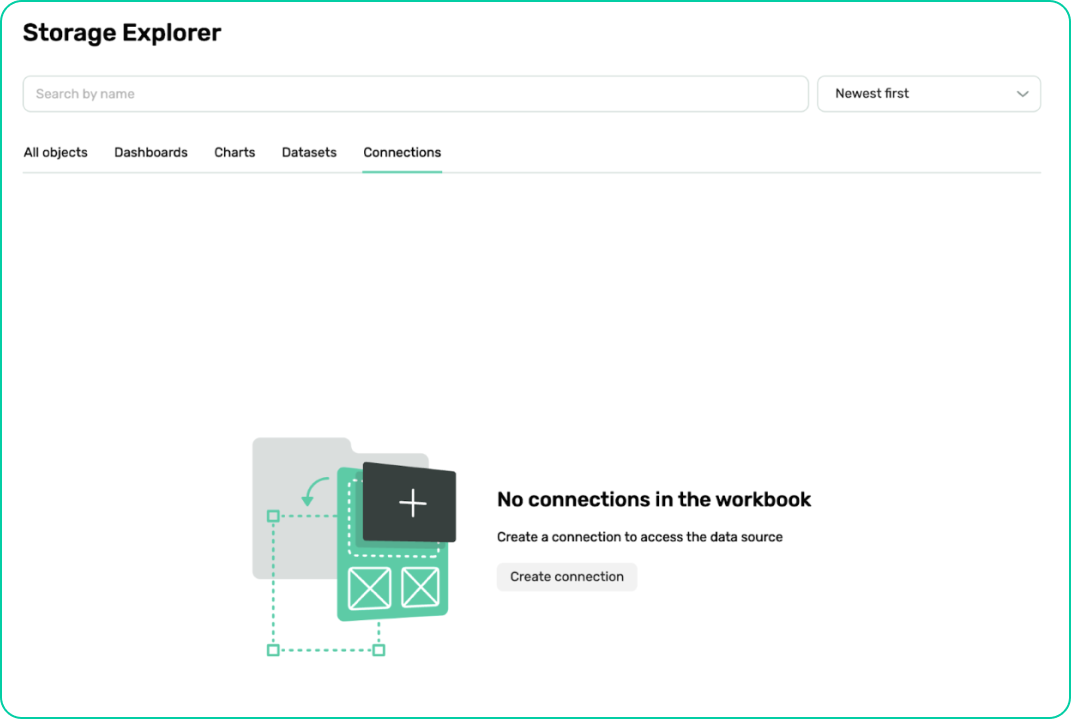
Head over to connections and create a connection:

Free DoubleCloud Visualization
Free visualization’s tool of your data that can natively read ClickHouse®
Select ClickHouse
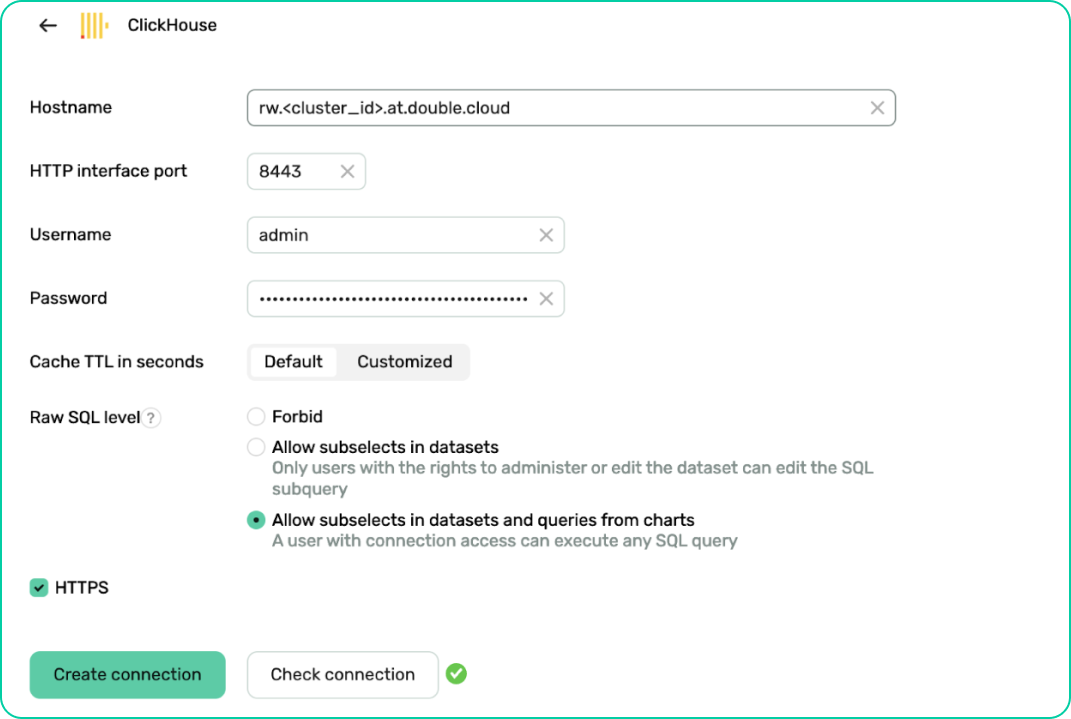
Make sure to select the “Allow subselects in datasets and queries from charts”
Hit Create connection — and provide a name to the connection
Head back to the workbook select the Charts tab and create a “QL Chart” — which will enable us to create a custom sql
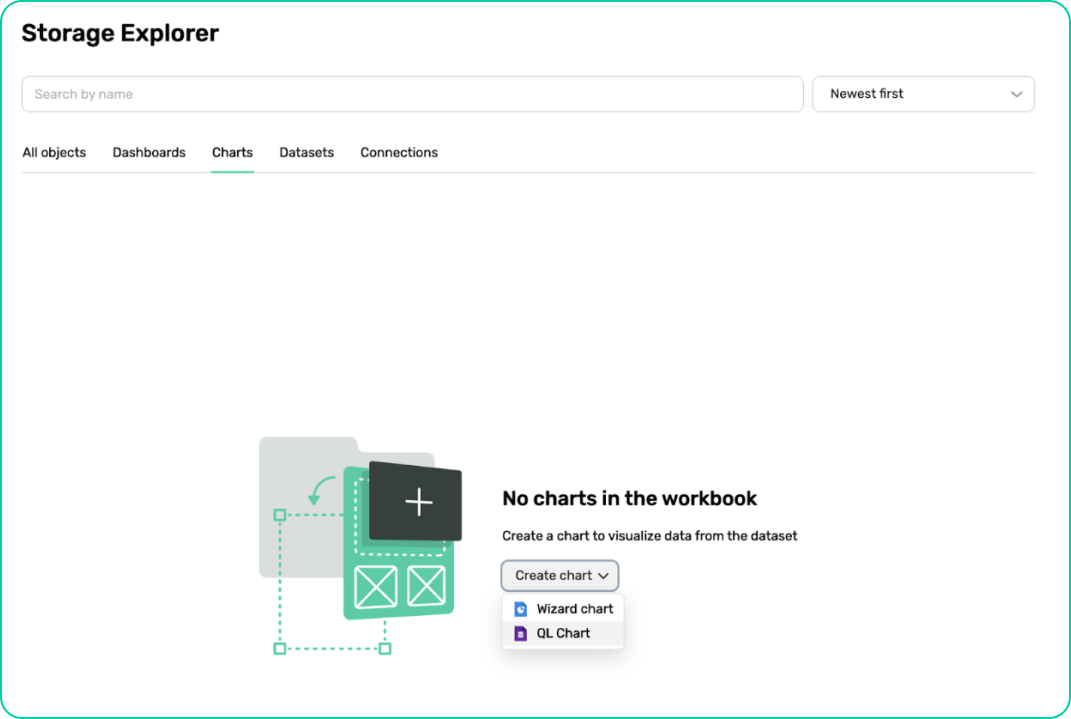
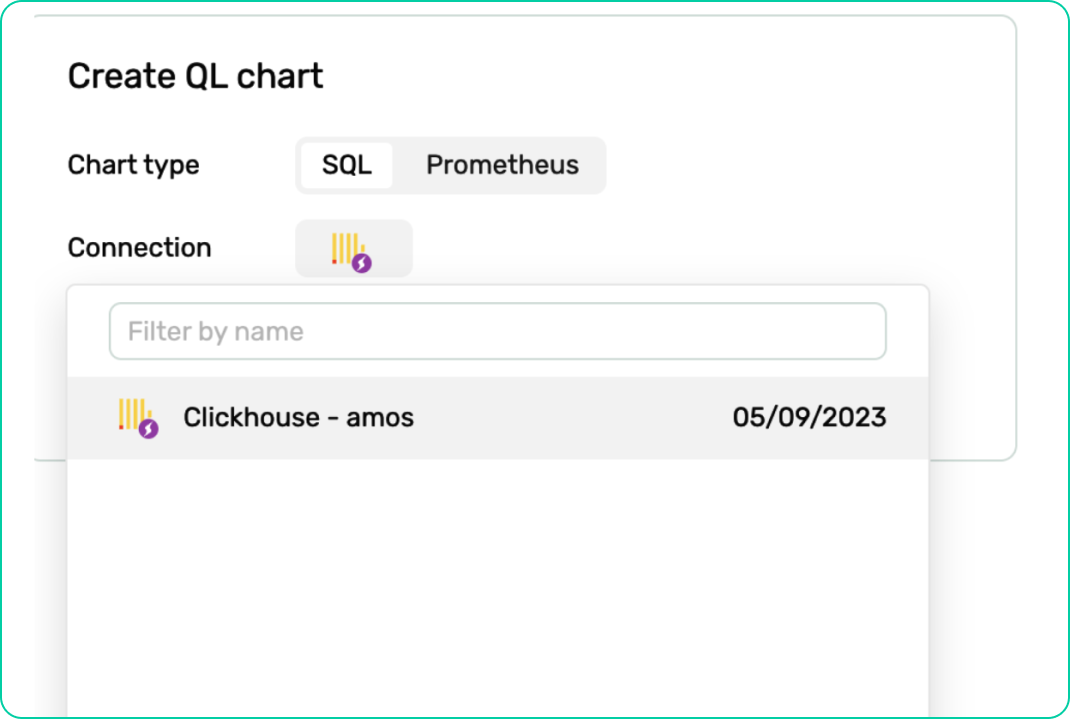
Select the connection we created before and between SQL and Prometheus choose the SQL chart:
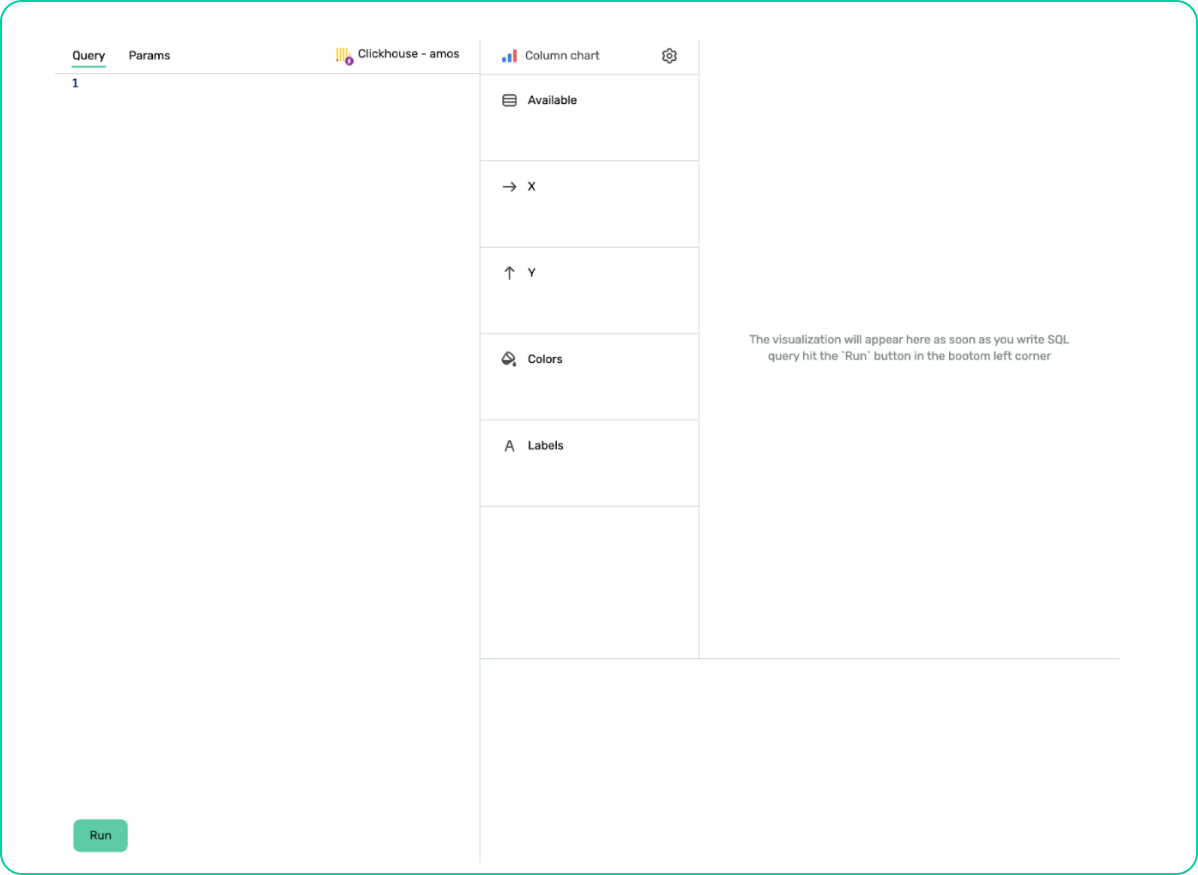
You should see something like this:
select if(parts.disk_name=='' or isnull(parts.disk_name),'Empty',parts.disk_name) as disk,database, tables.name,parts.name ,parts.bytes_on_disk
from system.tables
        full outer join system.parts
                        on parts.database = tables.database and parts.table = tables.name
where database not in (['_system','system'])
union all
select name,'free_space','free_space','free_space', free_space
from system.disks
where name = 'default'
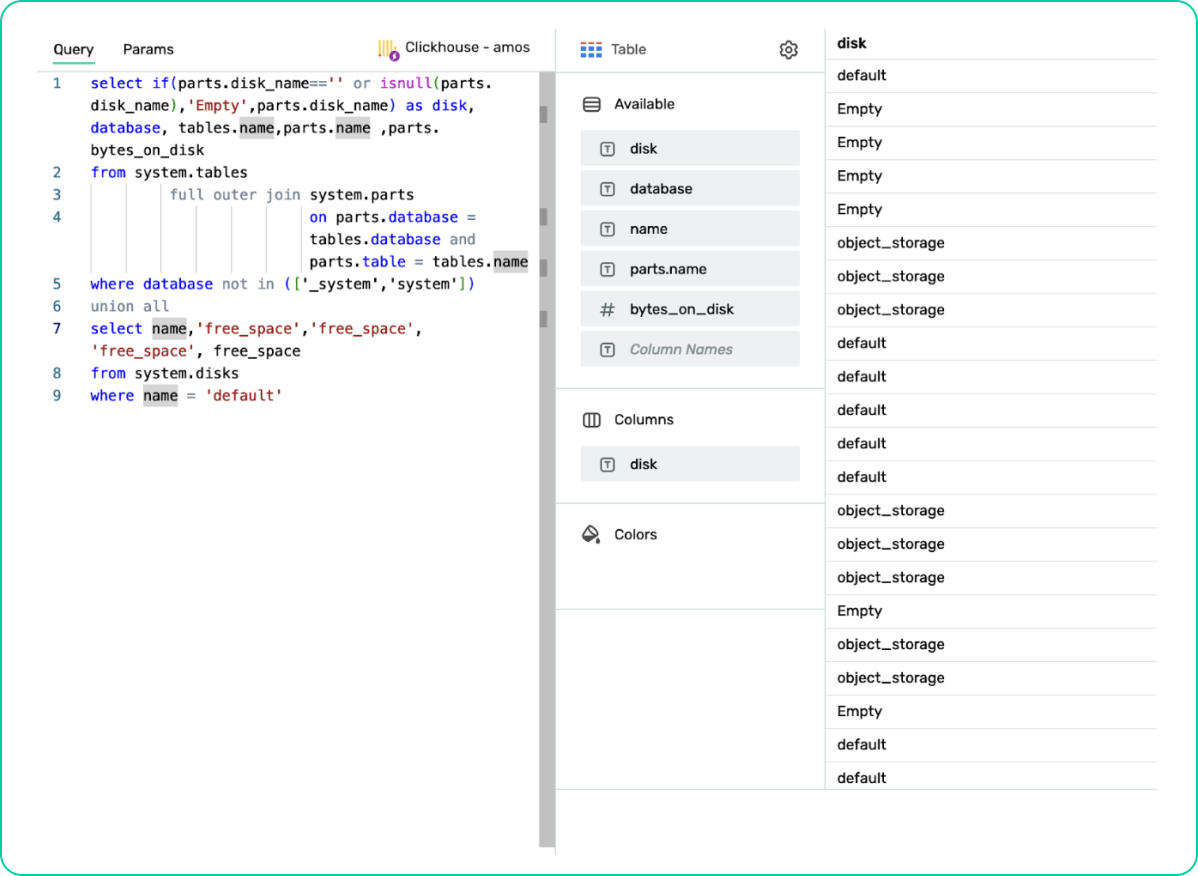
Now paste the query and switch to table widget and review the results:
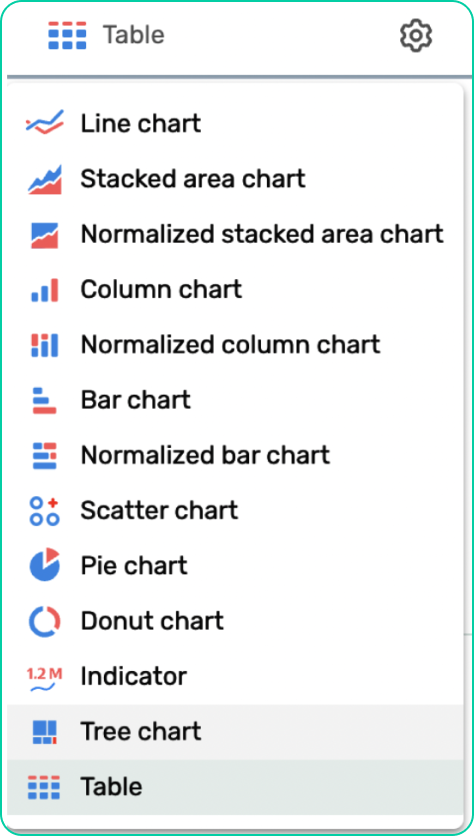
Select the Tree chart widget type using the gearbox icon:
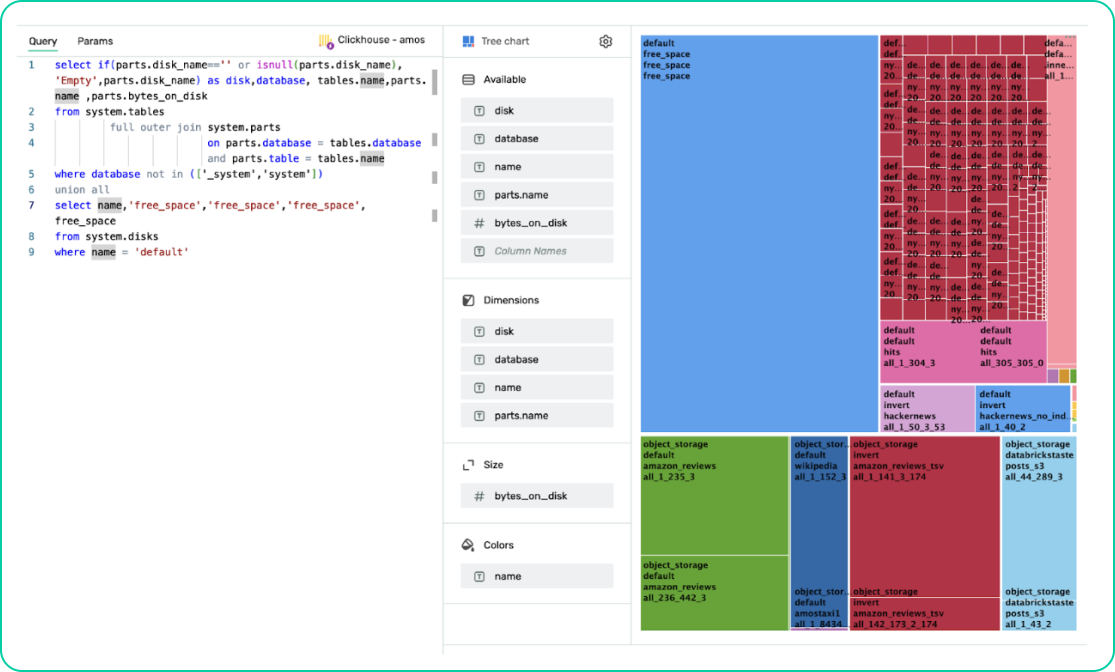
Configure the Treemap visual by setting the following fields:
Set “Dimensions” to “disk > database > name > parts.name”
Set “Size” to “bytes_on_disk”
Set “Color” to be based on “name” to show the color of each table
Customize the appearance of your Treemap visual with colours, labels, and tooltips that suit your taste.
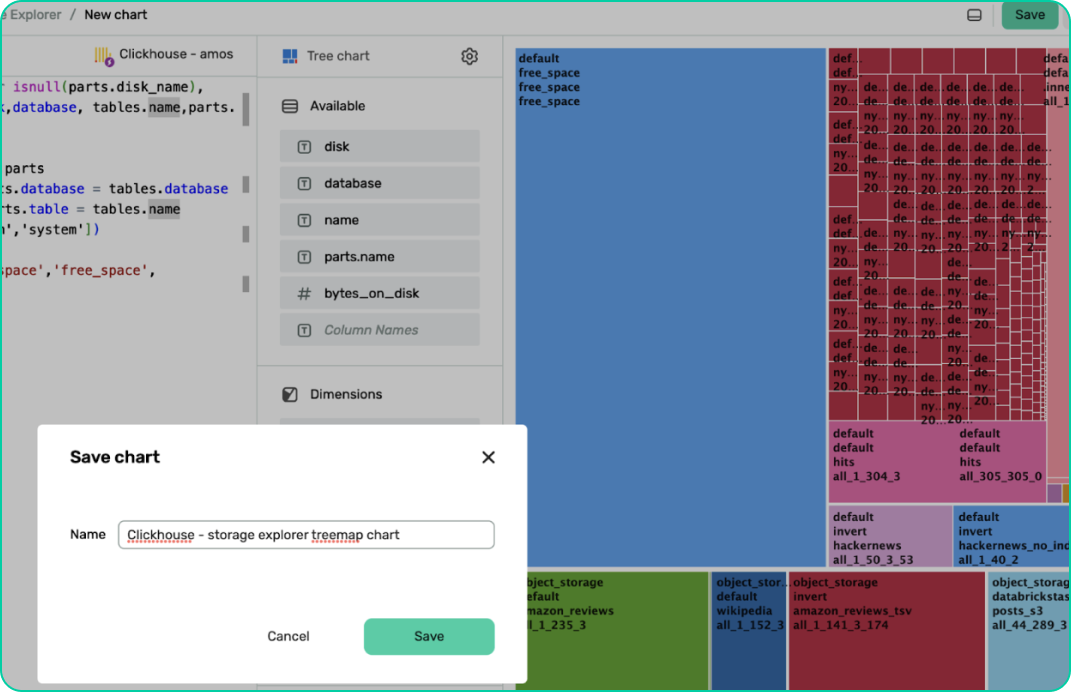
Save your masterpiece by clicking “Save” on the top right corner and watch the Treemap visual come to life on your dashboard.
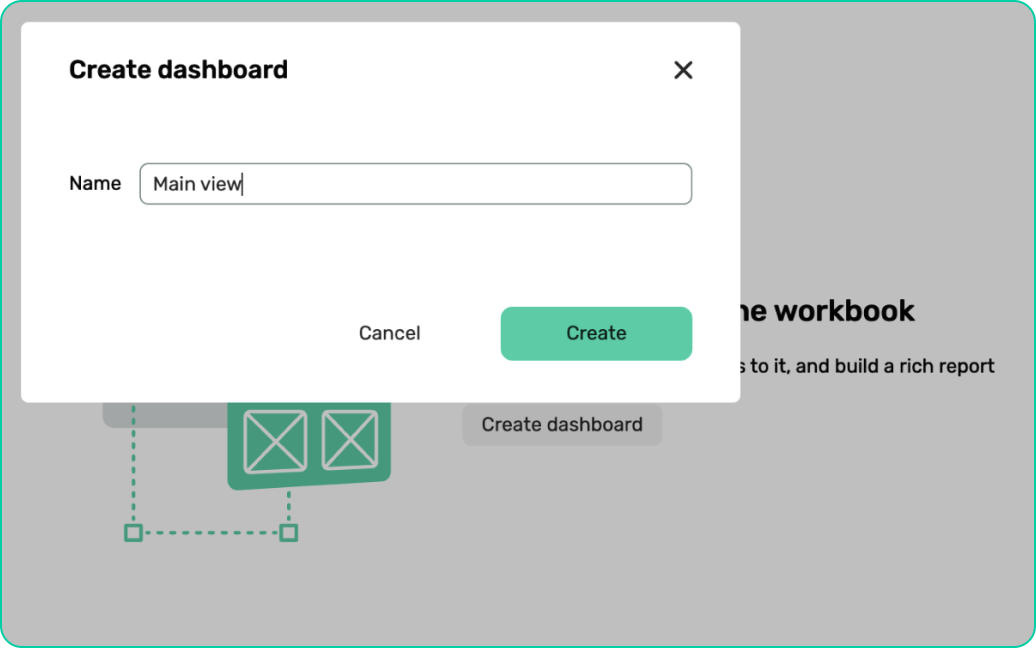
Head back to the workbook and create a dashboard:
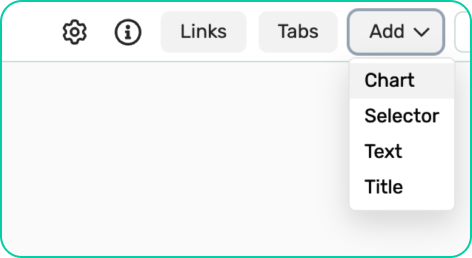
Click add chart
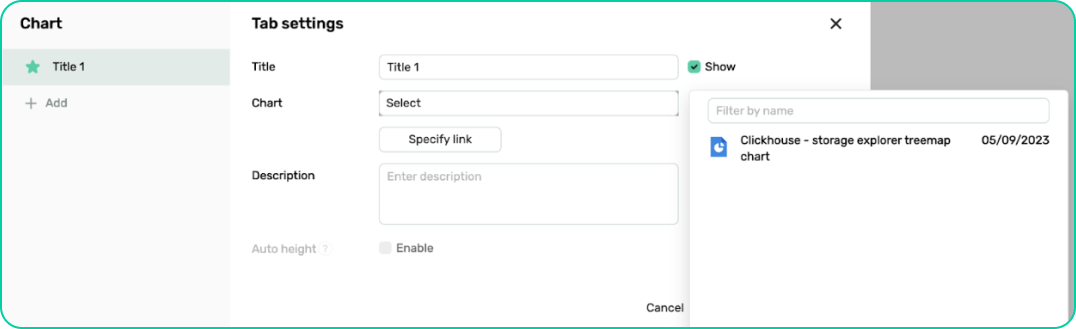
Select the chart we created before:
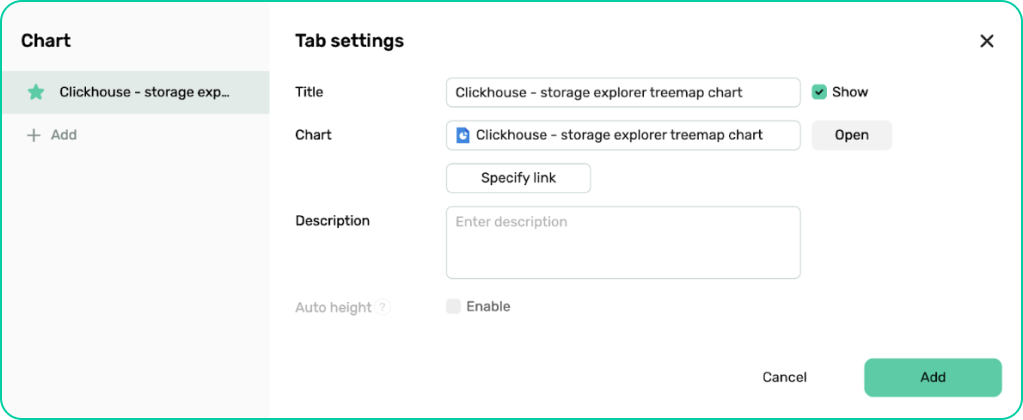
Should look like this after:
Resize the chart to suit your needs.
Congratulations, brave adventurer! You have successfully visualized your ClickHouse storage using DoubleCloud. With this newfound knowledge, you can now monitor your disk space usage, optimize your storage, and ensure that your ClickHouse kingdom prospers. So go forth and spread the word about this enchanting combination of ClickHouse and DoubleCloud, helping others in the land of data and analytics to better understand and manage their storage.
DoubleCloud Managed Service for ClickHouse®
An open-source, managed ClickHouse DBMS service for sub-second analytics.
Get started for free


