
Understanding the power of big data visualization
In today’s data-driven society, conveying complex data in an easy-to-read format is essential. Big data visualization is here to help when large lists of numbers and data can be challenging to understand, and important information can be lost within spreadsheets.
This article covers the importance of big data visualization techniques, tips for creating easily intelligible large data sets, and the best tools for data visualization. By the end of this article, users will be proficient in creating various charts, such as pie charts, bar charts, heat maps, histograms, and interactive charts.
What is big data?
In this article, we’ll talk about:
- What is big data?
- What is big data visualization?
- Role & importance of visualization in Big data analysiss
- Benefits of big data visualization for data analysis
- What are the types of big data visualization?
- Use cases of big data visualization tools
- Big data visualization tips for beginners
- Tools for big data visualization
- How DoubleCloud can help you with big data visualization
- Final words
- FAQ
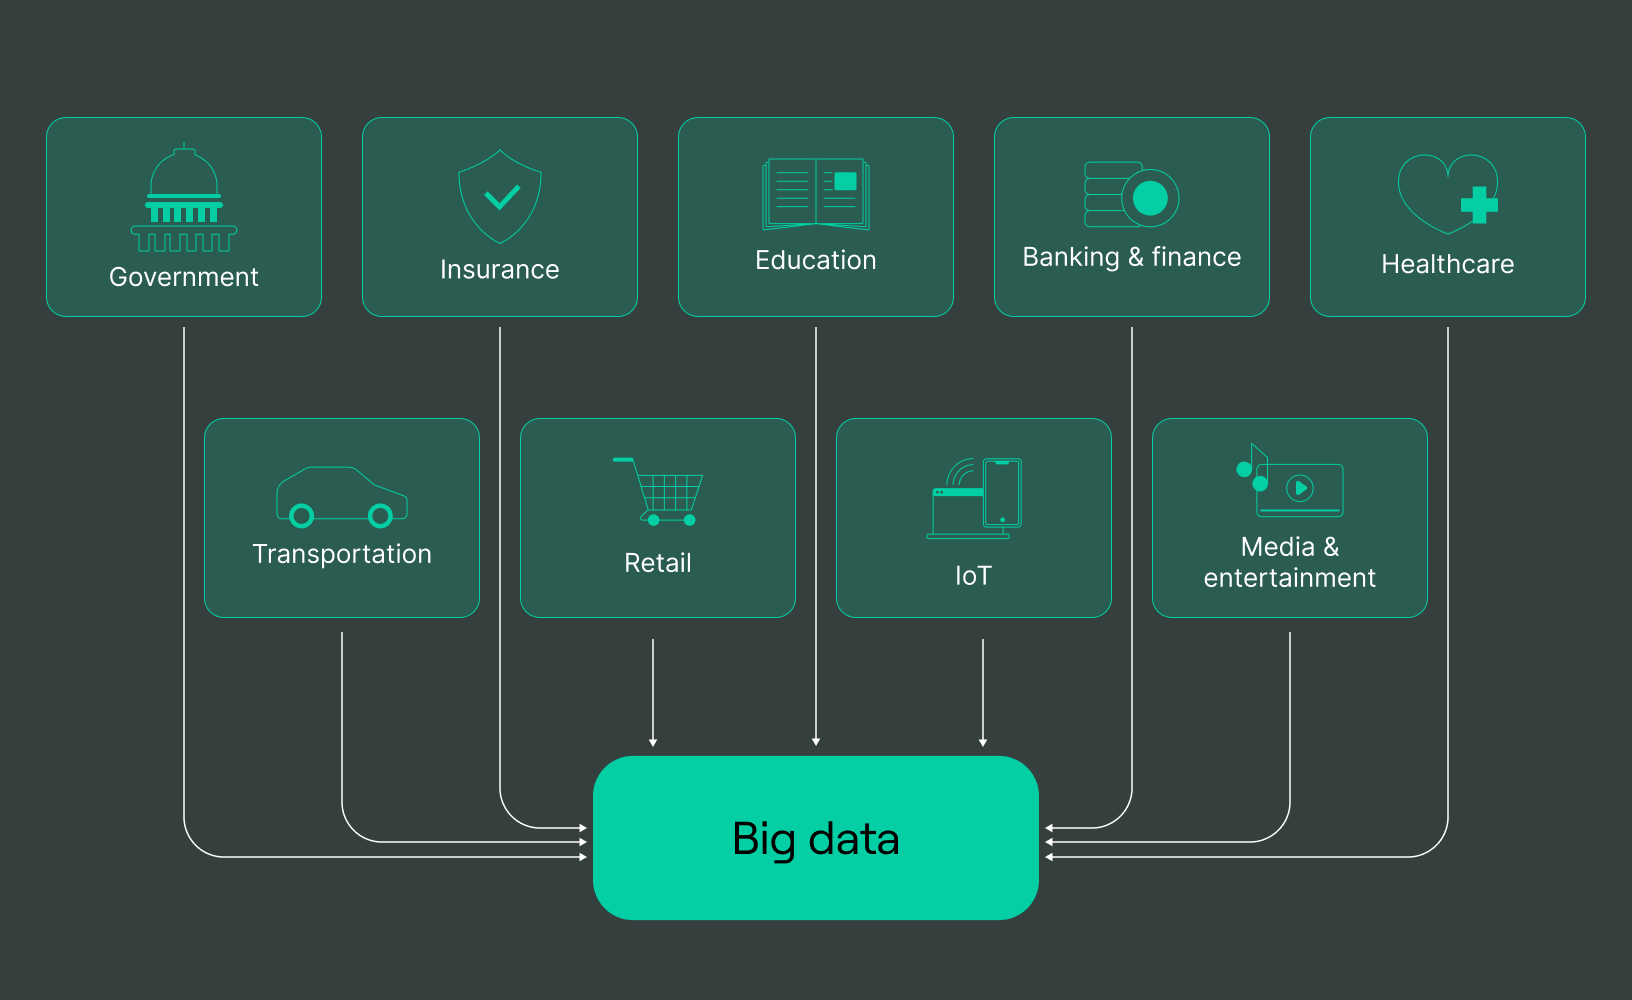
Big data refers to large, quite difficult data sets too tough to process and manage using traditional data-processing application software. The term “big data” is often characterized by these three “Vs”: volume, variety, and velocity;
Volume: Big data sets are so voluminous that traditional data processing software cannot operate with them. We are talking about tens of terabytes to hundreds of petabytes.
Variety: Big data sets have a greater variety. They come in increasing volumes and with more velocity. This can include data of unknown value, such as sensor-enabled equipment, clickstreams on a web page or a mobile app, or a Twitter data feed.
Velocity: Big data sets arrive at increasing speeds and must be processed quickly to extract value.
Big data can be both structured and unstructured. They can come from various sources, including internet clickstream logs, mobile apps, transaction processing systems, social networks, customer databases, emails, documents, and medical records.
What is big data visualization?
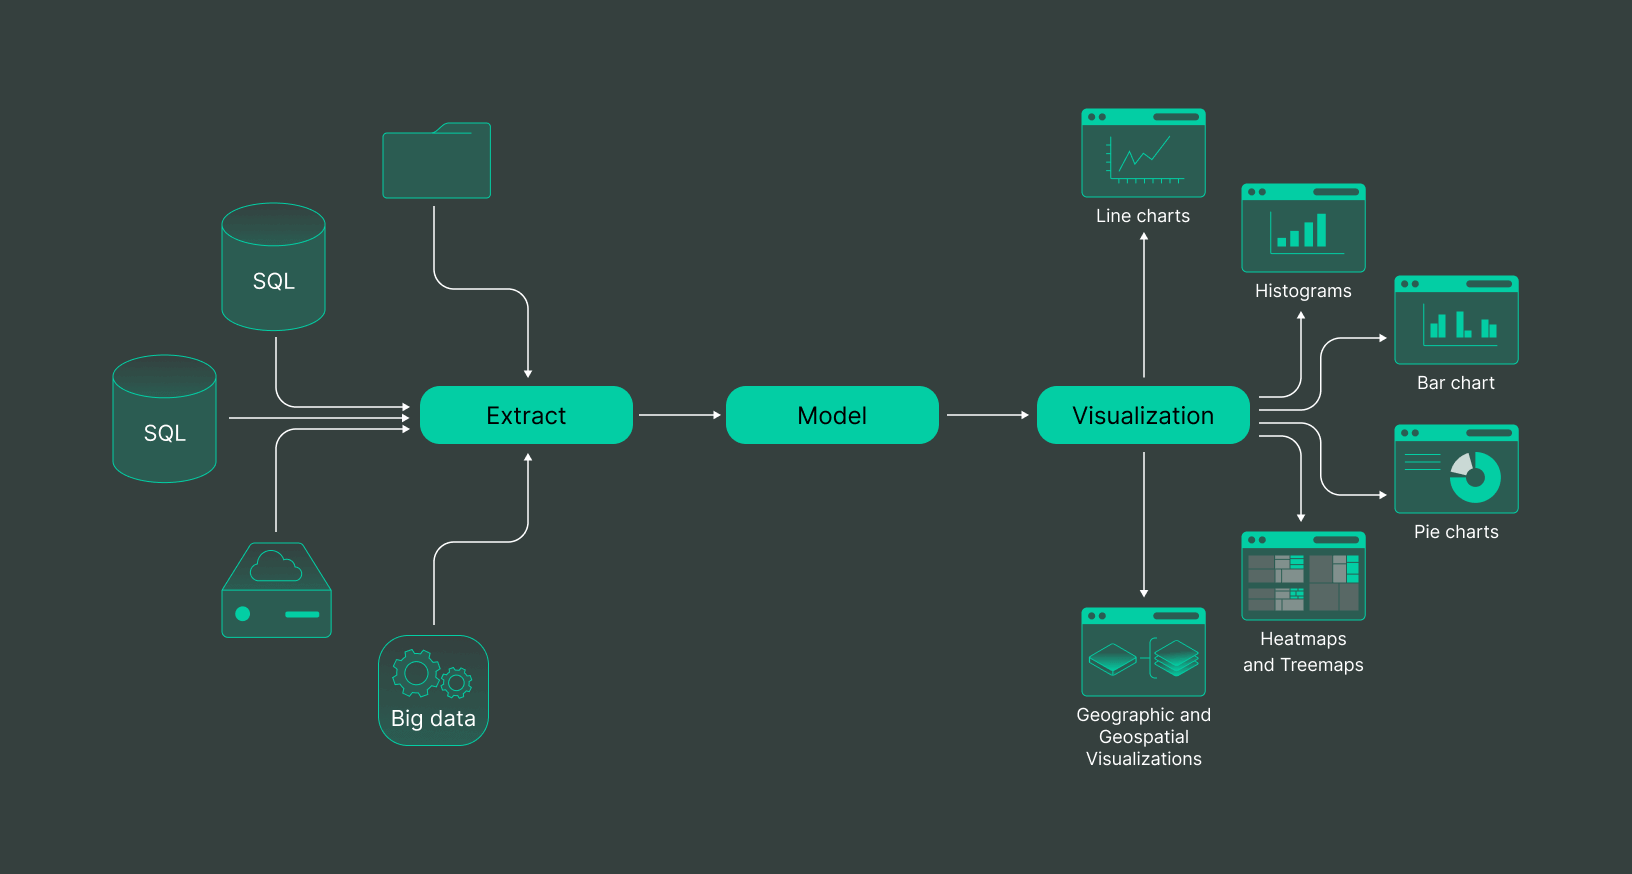
Data visualization is the process of displaying data in a visual form, such as a map, chart, or graph. This is to help the human brain comprehend and extract insights from it. Its main purpose is to uncover patterns, trends, and outliers in huge data sets. Data visualization is crucial because it requires data to be displayed after it has been gathered, processed, and modeled for conclusions to be formed.
Data visualization software has its uses in practically every profession because it allows information to be shown clearly and straightforwardly. It is also part of the larger DPA (Data Presentation Architecture) discipline, which seeks to find, process, format, and distribute data in the most efficient manner feasible.
Big data analysis is an integral part of data visualization. Every day, 2.5 quintillion bytes of data are created from social media, sensors, webpages, and all kinds of management systems. Applications such as Tableau, Google Charts, and Microsoft Power BI, as well as programming languages such as Javascript and Python, may help process raw data sets and transform them into graphic visualizations. A successful big data visualization approach will not only think about the data contained but also the most transparent manner to depict the conclusions drawn from it visually. This enables the creation of the most effective representations.
Role & importance of visualization in big data analytics
We live in an era where the internet and social media have experienced explosive growth. Information is not more challenging to get; we can quickly get what we want as it is right at our fingertips. This technological advancement, however, has decreased the human attention span, now about 8 seconds, as revealed by a study conducted by Microsoft Corporation.
As information keeps flowing and accepting access, it is now vital, more than ever, for businesses and organizations to present data quickly and easily understood formats. One of the few ways to achieve this is through big data visualization. By visually representing complex data, anyone can grasp the information at a glance.
Also, using data visualization tools can add value to your data and analytics so that those who see the data can interpret, understand, and use it effectively. This, in turn, contributes to the success of your company.
Data visualization optimizes the use of data, streamlines decision-making and planning processes, identifies and mitigates risks, and provides valuable insights to enhance overall company strategy.
Big data analytics and algorithms primarily focus on decision-makers that would greatly appreciate having insights presented in a format as such, saving them time and effort.
The plus of using big data visualization tools lies in presenting data visually without compromising accuracy. Users can take control of its precision and level of aggregation to suit their needs.
Moreover, visualization allows all vital information to be displayed in one place, creating dashboards and reports packed with valuable insights that can be passed across the business organization. How each person takes in, interprets, and remembers information is different. According to statistics, 65% of people worldwide are visual learners. For 30% of them, hearing is the best method of learning, and 5% learn best by doing and touching.
Benefits of big data visualization for data analysis
Data visualization has some key benefits that are quite helpful. With it, people can make decisions faster and better. Sometimes data can be complicated and hard to understand, but when we use pictures and graphs to show it, everything becomes much more straightforward. These visual tools, like charts, dashboards, and infographics, make it easier for us to see important information quickly.
We can easily spot essential things in the data when we look at these visuals. It’s like the data tells us a story, and we can focus on specific parts that would need our attention and discussion.
One of the cool things about data visualization is that it goes hand in hand with data analysis and also business intelligence. Data analysis can turn the data into nice pictures and easy-to-understand layouts. So, instead of reading long reports, you can interact with the data more fun and engagingly.
With data visualization, we can not only present the data but also explore it. We can find unusual things in the data, like outliers or anomalies. For example, we can use different graphs to see how the data is distributed or changes over time. And we can even zoom in and examine specific parts of the data more closely.
So, in simple words, data visualization is a helpful tool that makes data easy to understand, so we can make better decisions and dig out exciting things in the data.

Beetested Analyze Millions Of Gamers Emotions With DoubleCloud’s Managed ClickHouse Solution
What are the challenges of big data visualization?
Data visualization packs many advantages for businesses. However, the challenges of Big
Data visualization are numerous and complex. As decision-making often requires up-to-date and accurate insights, let’s take a look at some of the challenges below;
Performance and scalability issues
Visualizing big data sets can strain the performance and scalability of visualization tools. Processing and rendering large volumes of data in real-time can be resource-intensive and may require specialized infrastructure and technologies.
Dealing with large and complex data sets
Dealing with large and complex data sets can be challenging due to the data’s scale, complexity, and diversity. Traditional data analysis and visualization tools may not be able to handle the volume and variety of big data sets effectively.
Ensuring data accuracy and quality in visualizations
It relies on the quality of the underlying data. Challenges related to data quality, such as accuracy, completeness, relevance, consistency, and reliability, can impact the effectiveness of visualization.
Privacy and security considerations
Big data often contain sensitive and confidential information. Ensuring data privacy and security while visualizing and sharing data can be challenging, especially when dealing with large and diverse data sets.
What are the types of big data visualization?
Several types of Big Data visualization can be used to represent and interpret large volumes of data effectively. Each type has its strengths and can be chosen based on the specific needs and goals of the visualization project; they are:
1. Line charts
A line chart, also known as a line graph or line plot, is a typical style of chart used to demonstrate how one object changes in comparison to another, often over time. The lines are made by connecting points on the graph with straight lines. It’s effective for identifying patterns and relationships between disparate objects.
2. Histograms
A histogram helps see how often different values appear in a data set. The data is arranged into groups, and we can see how many data points fall into each group. This way, we can understand the pattern of how frequently each value occurs.
The histogram gives us a clear picture of the frequency distribution of the data. We can see if the data is spread evenly or if more values are clustered towards one end. This helps us rank the distribution as symmetric, right-skewed (when values are stretched out to the right), or left-skewed (when values are stretched out to the left).
3. Bar chart
A bar chart, also called a bar graph, can be used by data scientists to represent their data analysis visually with rectangular strips/bars. Whether horizontal or vertical, the taller the bar, the bigger the numerical value; this is also applicable the other way around. The bar chart can be used in comparing large amounts of data, fluctuations of quantities, or different categories.
4. Pie charts
Pie charts are known by many names; circle graphs, donut charts, etc. They are data visualizations divided into smaller parts and sizes to depict numerical values.
Using a pie chart, you can easily observe and compare how the various portions relate to and differ.
Avoid cramming a pie chart with too much distinct data when utilizing it. When you divide the pie chart into more than seven portions, the data might become difficult to read.
5. Heatmaps and Treemaps
Treemaps use color-coded rectangles to display hierarchical data visually. Users may utilize treemaps to compare several data sets and display each item’s weight in a project.
A heat map is a visual representation of data set out on a map or table and employs various color nuances and intensities to express its contents. A heat map may be extremely useful when analyzing data that seems to be endless.
6. Scatter plot
In data visualization, a scatter plot depicts the relationship between two variables. It consists of a grid where one variable is shown on the x-axis and the other on the y-axis. In a scatter plot, each data point is represented by a dot. Its position indicates the values of both variables.
7. Geographic and Geospatial Visualizations
These involve using maps and spatial data to represent and analyze big data. They allow for identifying location-based patterns and trends, which can be particularly useful in logistics, urban planning, and marketing.
Use cases of big data visualization tools
Big Data visualization tools have become essential for businesses handling transactional workloads. These tools help overcome the challenges posed by data sources' sheer volume, variety, and complexity. They are;
Visualizing customer behavior and user engagement
Big data visualization tools analyze customer behavior patterns, like purchase history and website interactions, providing insights into user engagement and decision-making. They identify trends, enabling businesses to personalize marketing strategies and improve customer satisfaction.
Monitoring and analyzing system logs and performance metrics
These tools help businesses monitor and analyze system logs, performance metrics, and usage patterns, enabling informed decisions and optimizing performance. They also track usage patterns for enhanced efficiency and security.
Analyzing social media trends and sentiment analysis
These tools analyze social media trends, sentiment analysis, and customer preferences, enabling businesses to make data-driven decisions, improve products, and identify real-time issues.
Predictive analytics and forecasting
These tools enable businesses to use predictive analytics and forecasting to anticipate future trends, identify patterns, and make proactive decisions, enabling better planning and resource allocation.
Big data visualization tips for beginners
Beginners in the field need to be conversant with the terminologies and briefed on what they should expect. To effectively visualize big data, beginners should consider the following practical tips and guidelines:
Understand the data: Have a deep understanding of the data you are working with, including its structure, variables, and relationships. This understanding will guide your visualization methods and help you identify relevant insights.
Select appropriate big data visualization techniques: Select appropriate big data visualization techniques for data types and insights, such as scatter plots, heat maps, network graphs, or parallel coordinates.
Design visually appealing and informative visualizations: Create visualizations that are visually appealing and quite easy to interpret. Use appropriate colors, labels, and annotations to enhance clarity and understanding. Ensure the visualizations effectively communicate the intended message and highlight the key insights.
Simplify and filter the data: Big data sets can be overwhelming, so it’s essential to simplify and filter the data before visualizing it. Apply data aggregation, sampling, or filtering techniques to reduce the complexity and focus on the most relevant aspects of the data.
Consider scalability and performance: Data visualization can impact performance and scalability; optimize performance using efficient tools and technologies like parallel processing or distributed computing.
Iterate and refine: Visualization is an iterative process. Continuously review and refine your visualizations based on feedback and insights gained. Experiment with different visualization techniques and layouts to find the most effective data representation.
Tools for big data visualization
These tools must support diverse data sources and offer instant analysis, enabling users to understand correlations, trends, and patterns. The main tools for Big Data VIsualization are:
-
IBM Cognos Analytics
-
Visual.ly
-
Power BI
-
Microsoft PowerBI
-
Oracle Visual Analyzer
-
FineReport.
-
Tableau Desktop
-
Qlik solution — QlikSense and QlikView
-
Sisense
-
Periscope Data
-
Zoho Analytics
-
DoubleCloud
TripleTen replaces Metabase & builds powerful BI with DoubleCloud
Encountering significant problems with Metabase, TripleTen switches over to DoubleCloud for building BI.
How DoubleCloud can help you with big data visualization
DoubleCloud offers a comprehensive suite of tools and technologies to help businesses visualize and analyze big data effectively. With its advanced data visualization capabilities, DoubleCloud data visualization enables users to create interactive graphs, charts, and maps that provide valuable insights into their data.
DoubleCloud’s integration with geospatial data allows for creating stunning geospatial visualizations that uncover hidden patterns and trends in location-based data. Businesses can use these potent visualization techniques to make wise decisions and gain an edge in their industries.
Final words
In conclusion, harnessing the power of big data and utilizing advanced analytics tools can greatly benefit businesses in various ways. Companies can learn a great deal about the opinions and preferences of their customers by analyzing social media trends and sentiment analysis, which enables them to customize their products and services.
Additionally, predictive analytics and forecasting enable businesses to stay ahead of the curve by anticipating big data marketplace trends and making informed decisions. To fully leverage these capabilities, we recommend utilizing DoubleCloud for seamless integration and maximum efficiency in managing big data.

DoubleCloud Visualization. Get insights with ChatGPT!
Don’t waste time reading numerous reports and manually analyzing data — rely on AI-Insights and get fast and accurate conclusions.
Frequently asked questions (FAQ)
How can big data visualization improve decision-making processes?
How can big data visualization improve decision-making processes?
It can improve decision-making processes for more complex representations by providing clear and concise visual representations of complex data sets. This allows decision-makers to easily identify trends, patterns, and correlations that may not be apparent in raw data.
What is the best visualization for large data sets?
What is the best visualization for large data sets?
Why is big data visualization important?
Why is big data visualization important?
Why is it difficult to visualize big data?
Why is it difficult to visualize big data?
Start your trial today


